Your finance team has a fair question. You want to spend money getting your brand cited in ChatGPT and Google AI Overviews, but those citations don’t always send a click, and a click is what every reporting dashboard was built to count. So how do you prove the spend is working?
This is the wall most marketers hit with Answer Engine Optimization. The tactics make sense. The problem is the math. Traditional ROI formulas assume a visitor lands on your site, gets tracked, and converts in a path you can follow. AEO breaks that assumption, because a large share of its value shows up before anyone reaches your site, or never produces a session at all.
This guide gives you a framework for measuring the return on AEO spend in dollars, not just dashboards. We’ll cover why click-based ROI undercounts AEO, how to assign value to a citation, how to attribute revenue when there’s no click to follow, and how to model the return on a specific product like a $300 Exclusive Media Link or a $3,500 Earned Media campaign. If you want the full menu of products this framework applies to, our AI visibility services page lays out every tier.
Why traditional ROI math undercounts AEO
The classic marketing ROI formula is simple: take the revenue a channel produced, subtract what you spent, divide by the spend. The trouble is that the first variable, revenue produced, depends on attribution, and attribution depends on a click you can track. AEO routinely produces value without that click.
Consider what happens when someone asks ChatGPT for the best provider in your category and your brand is named in the answer. The person may never visit your site that day. They might search your brand name directly a week later, or remember you when a colleague asks for a recommendation. The citation did real work, but a last-click model credits the branded search, the direct visit, or nothing at all.
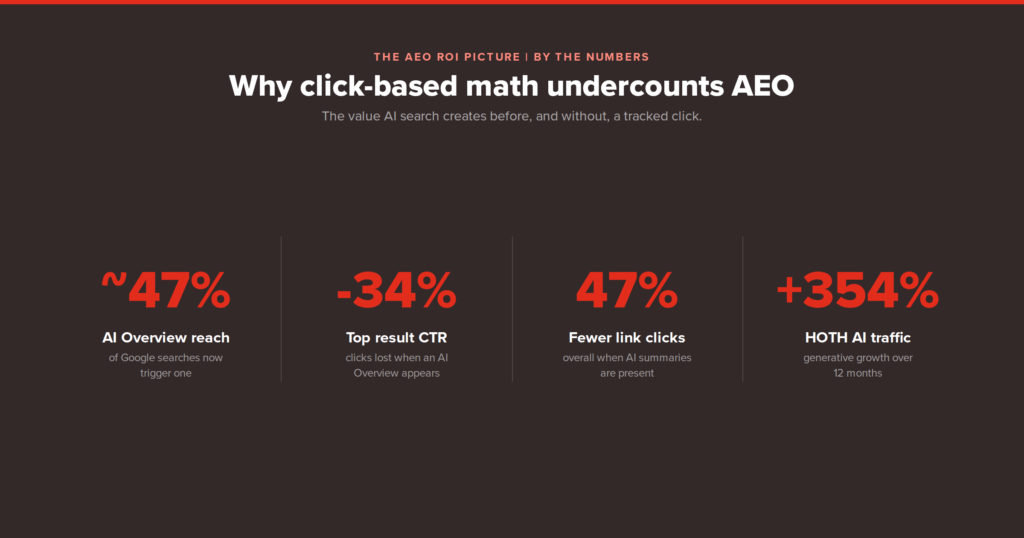
This is not a small leak. Roughly 47% of Google searches now trigger an AI Overview, and when one appears, the top organic result loses about 34% of its clicks. Users are around 47% less likely to click any link at all when an AI summary is present. The traffic that used to flow through trackable sessions is increasingly being answered inside the AI layer, where your brand is either named or it isn’t.
So the first step in measuring AEO ROI is accepting that the denominator is easy and the numerator is the hard part. Your spend is known to the dollar. The return requires a model for valuing visibility that does not produce a click. The rest of this guide builds that model.
The three layers of AEO value
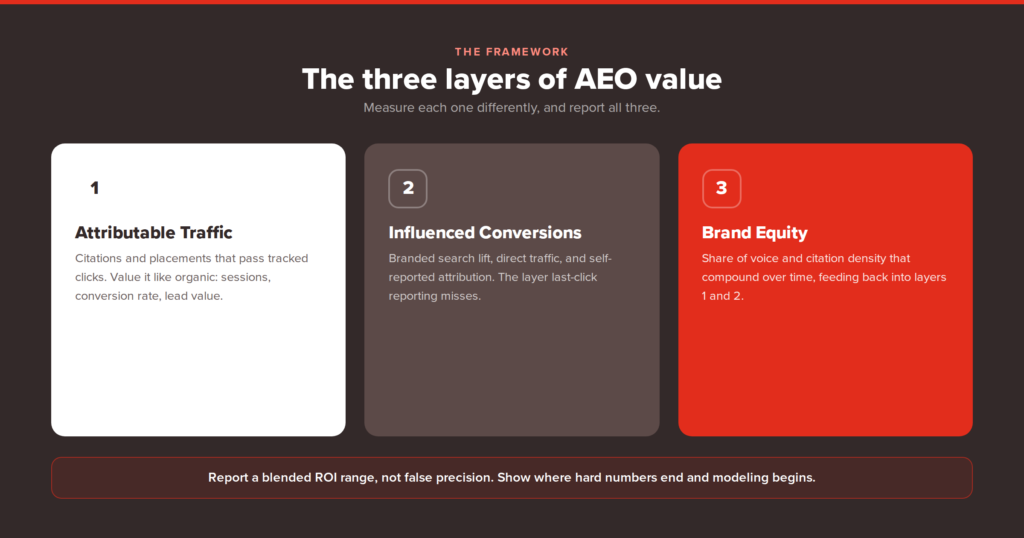
Before you can put a number on AEO, separate its value into three layers. Each is measurable, but each needs a different method. Lumping them together is what makes AEO feel unmeasurable.
Layer 1: Direct attributable traffic
Some AEO value still behaves like classic SEO. A citation in an AI Overview or a Perplexity answer includes a link, the user clicks it, and you get a tracked session. Editorial placements on news sites also pass referral traffic and, over time, lift your organic rankings. This is the easiest layer to value because it lands in your analytics like any other visit. Treat it exactly as you would organic traffic: sessions times conversion rate times average order value or lead value.
Layer 2: Influenced conversions
This is the layer last-click reporting misses. An AI citation plants your brand name, and the conversion arrives later through a branded search, a direct visit, or a different channel entirely. You can see the fingerprints of this layer even when you can’t trace the exact path: rising branded search volume, more direct traffic, and a shorter sales cycle for deals that mention having seen you recommended. We’ll cover how to quantify this below.
Layer 3: Brand equity and authority
The slowest and most compounding layer. Every editorial placement and AI citation adds to the body of evidence that AI systems use to decide whether your brand is safe to recommend. This raises your share of voice over time, which raises citation frequency, which feeds back into Layers 1 and 2. It is the hardest to value in a single month and the most valuable over a year.
A defensible AEO ROI number reports all three layers, clearly labeled, rather than pretending Layer 1 is the whole story or that Layer 3 can’t be measured at all.
How to assign a dollar value to a citation
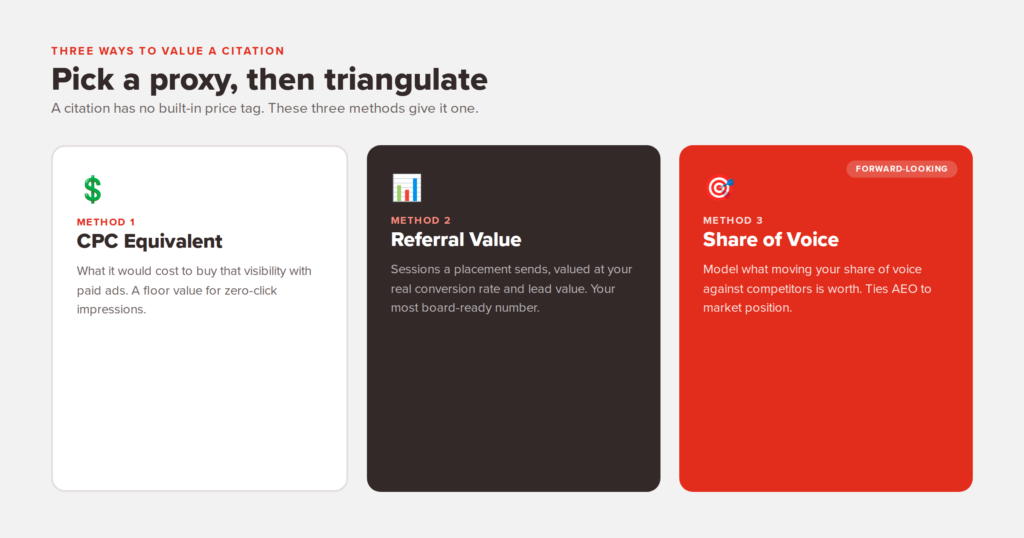
A citation has no built-in price tag, so you assign one using a proxy. There are three practical methods, and the right move is usually to triangulate across all three rather than trust one.
Method 1: Cost-per-click equivalent
Ask what it would cost to buy the visibility a citation gives you. If your brand is cited in an AI Overview for a query where the paid cost-per-click is $12, and that AI Overview appears on a keyword with 10,000 monthly searches, the impression value is real even without a click. Pull the CPC from your PPC data or a keyword tool, multiply by a conservative share of the impressions you’d realistically capture, and you have a floor value for that placement.
Method 2: Referral traffic value
For citations and editorial placements that do pass clicks, value them like any traffic source. Track the sessions each placement sends, apply your site-wide conversion rate, and multiply by your average lead or order value. This is your cleanest, most board-ready number because it uses data your finance team already trusts.
Method 3: Share-of-voice modeling
The forward-looking method. Tools like Ahrefs Brand Radar measure your share of voice across AI platforms against competitors. If you can establish that a competitor with a 40% share of voice in your category captures a known volume of business, you can model what moving your own share from 10% to 25% is worth. This is an estimate, not a receipt, but it’s the method that ties AEO directly to market position, which is the argument leadership actually cares about.
Here’s how the three methods compare:
| Method | Best for | Reliability |
|---|---|---|
| CPC equivalent | Valuing zero-click impressions and AI Overview presence | Directional floor value |
| Referral traffic value | Placements that send tracked clicks | High, uses trusted analytics |
| Share-of-voice modeling | Tying AEO to market position over time | Estimate, best for forecasting |
Attributing revenue when there’s no click to follow
Layer 2, influenced conversions, is where most AEO value hides and where most marketers give up. You don’t need a perfect path to make the case. You need a few signals that move together when your AEO program is working.
- Branded search volume. When AI systems cite you more, more people search your brand name directly. Track branded query volume in Google Search Console before and during a campaign. A clear lift that tracks your citation growth is strong evidence of influenced demand.
- Direct traffic. People who saw your name in an AI answer often type your URL or tap a bookmark later. A rising direct-traffic line during an AEO push, with no other obvious cause, points to the same effect.
- Self-reported attribution. Add a ‘How did you hear about us?’ field to your lead forms and sales calls. When prospects start saying they saw you recommended by an AI tool or read about you in the press, you have direct, quotable proof that no analytics platform can give you.
- Assisted conversions. In a data-driven or position-based attribution model, give credit to the referral and organic touches that AEO produces, rather than awarding everything to the final click. This alone reframes how much of your pipeline AEO is quietly supporting.
None of these is a perfect dollar figure on its own. Together, they let you say something a last-click report never could: branded demand rose X%, direct traffic rose Y%, and Z% of new leads named AI or press coverage as how they found us, during the exact window we invested in AEO. That is an attribution story leadership will accept.
Modeling the return on a specific AEO product
The framework gets concrete when you apply it to a real line item. Here’s how to think about two common AEO investments. The point isn’t the exact figures, which vary by industry and conversion economics, but the structure of the model.
A single Exclusive Media Link
An EML Silver placement runs $300 for a DR 30+ US news site placement with evergreen editorial content. To model its return, count three things: the referral traffic the placement sends over its lifetime, the ranking lift from a contextual dofollow link on a trusted domain, and its contribution to the citation density AI systems read when deciding whether to name you. A single link is a small input, but because the content is evergreen, you’re amortizing $300 across years of presence, not a one-month flight.
An Earned Media campaign
A HOTH Earned Media campaign runs $3,500 per month and earns 50+ placements across 4,000+ US publishers in a single campaign. Model it across all three value layers: direct referral traffic from the placements, the influenced demand visible in branded search and direct traffic lifts, and the share-of-voice gain that compounds month over month. The product’s whole design is to maximize Layer 3, the citation density that is hardest to fake and most rewarded by AI systems.
The HOTH’s own results show what that compounding looks like in practice. By investing consistently in off-page authority, the company grew its generative AI traffic 354% over 12 months. One ecommerce client earned 149 AI mentions from a single Content Refresh campaign, alongside a 25% traffic increase. A moving-services client earned more than 69 AI citations through Earned Media and editorial coverage, and a stationery brand added nearly 5,000 in traffic over five months from off-page AEO alone. Those are the kinds of outcomes the three-layer model is built to capture.
Putting your AEO ROI report together
A report leadership will sign off on doesn’t hide the uncertainty in Layers 2 and 3. It labels each layer and shows its method. Here’s the structure to use:
- Spend, to the dollar. Every AEO product and its cost for the period.
- Layer 1 return. Tracked sessions from citations and placements, valued at your real conversion economics.
- Layer 2 evidence. Branded search lift, direct traffic lift, and self-reported attribution percentages for the campaign window.
- Layer 3 trajectory. Share-of-voice change and citation frequency over time, framed as a forward indicator of market position.
- A blended ROI range, not a single false-precision number. Conservative and optimistic bounds are more credible than one figure that pretends Layer 2 is exact.
This structure does something important: it separates what you can prove from what you can reasonably infer, so a skeptical CFO can see exactly where the hard numbers end and the modeling begins. That honesty is what gets the next budget approved.
Where to start
AEO is measurable. It just needs a framework that fits how AI search actually creates value, instead of forcing it into a click-based model built for a different era. Separate the value into three layers, assign citation value with a proxy method, gather influenced-conversion evidence you can defend, and report a range rather than false precision.
If you’d rather have a strategist build and report this for you across every channel, that’s exactly what AI Discover is designed to do, with citation tracking and share-of-voice reporting built in. To see which AEO products fit your goals and budget, start with our AI visibility services page, or book a call and we’ll map the right starting point for where your brand stands today.
Leave a comment