

Your AI visibility score is a sample, not a measurement, and most sampling methods in use right now are too small and too loosely controlled to support the decisions being made on them. The same prompt returns different answers on different runs, the prompt set is usually chosen by the brand being measured, and no two engines agree on who to cite. Before you act on the number, you need to know how much of it is signal.
You have a number. Maybe it comes from a platform dashboard, maybe from a spreadsheet your team fills in once a month. It says you appear in 22% of AI answers in your category. Last month it said 17%.
Somebody is about to call that a 29% improvement and put it in a board deck.
It might be real. It might also be the same underlying performance measured twice. There is no way to tell from the number alone, and that is the problem worth solving before you spend another dollar against it.
We build AI visibility programs for a living, and AI Discover reports citation frequency to clients every month. We also just published twelve months of campaign findings from this work, which is exactly why this post exists: running the campaigns taught us how hard the results are to measure cleanly. So this is not an argument that measurement is hopeless. It is an argument that the measurement most teams are running has error bars nobody has calculated, and that those error bars are usually wider than the changes being celebrated.
This post covers where the noise comes from, how much of it there is, and what to report instead.
What happens when you run the same prompt twice?
You often get a different answer. Large language models are not deterministic in production even when the settings say they should be, because the result depends on server conditions outside your control. A prompt that cites you at 10:04 can omit you at 10:06 with nothing about your site having changed.
Most people assume that if you ask an AI tool the same question twice, you get the same answer twice, and that any difference means something changed. Neither half of that is safe.
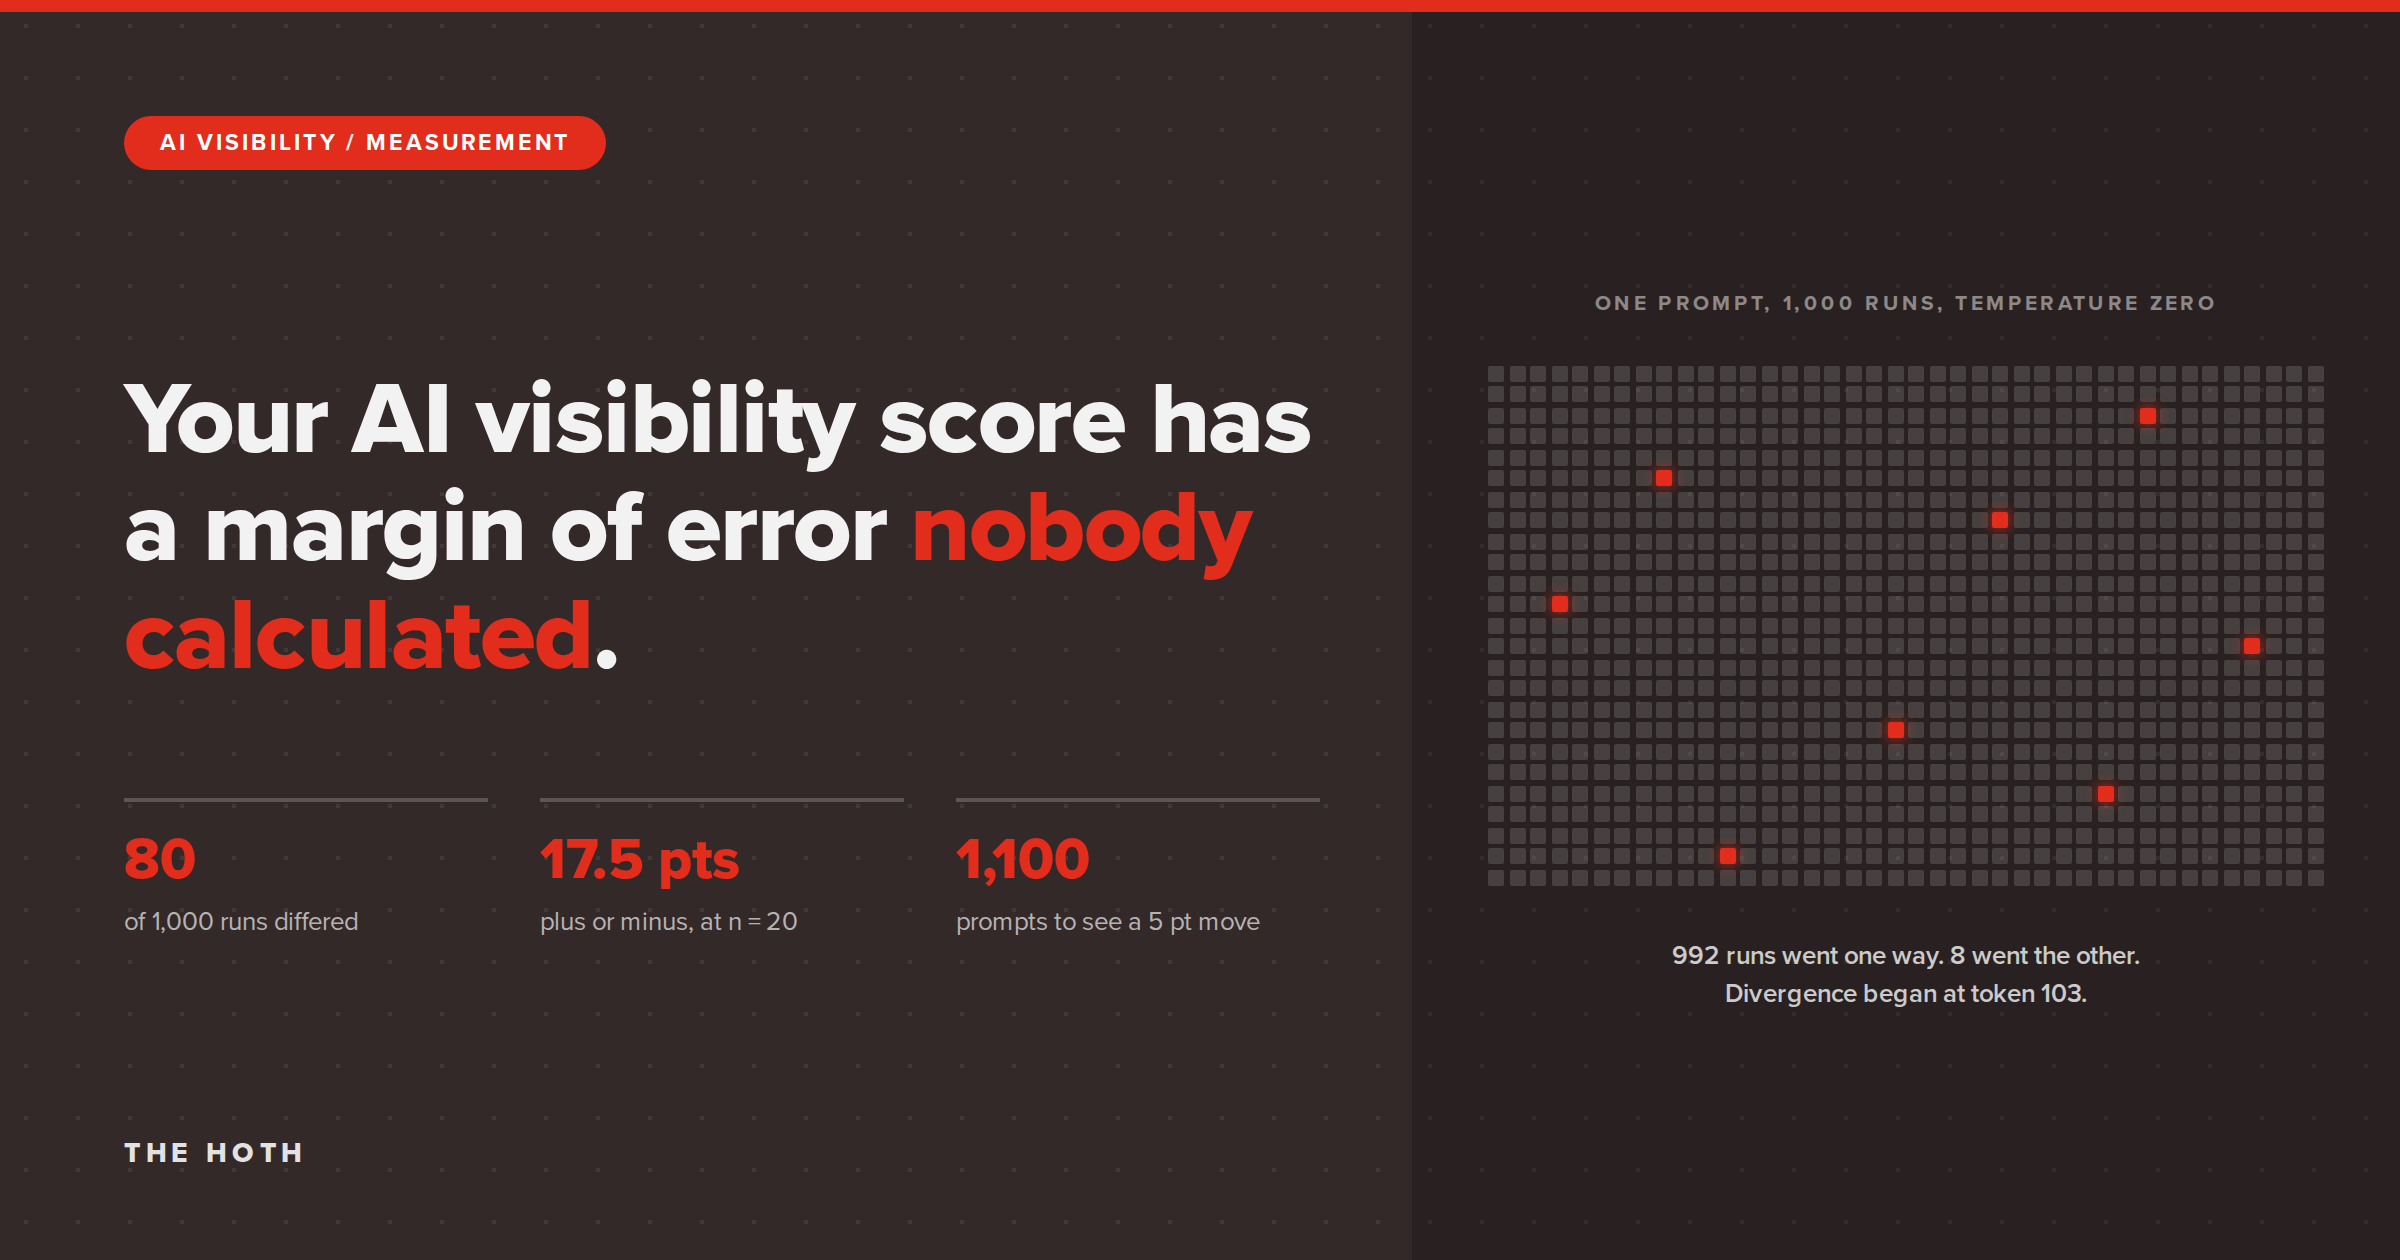
Thinking Machines Lab ran the cleanest public demonstration of this. In their research on nondeterminism in LLM inference, they sampled the same prompt 1,000 times at temperature zero, the setting that is supposed to make the model pick the highest probability word every time and therefore behave identically on every run. They got 80 different completions. The most common one appeared 78 times out of 1,000.
The mechanism matters, because it tells you the variance is not going away on its own. The completions were identical for the first 102 tokens. At token 103, they split: 992 of the runs continued one way, 8 went another. Their finding was that the divergence traces back to how inference servers batch requests together. Your query gets grouped with whatever other users happen to be querying at that moment, the batch size shifts the arithmetic slightly, and a small numerical difference is enough to flip which word comes next.
In other words, the answer you get depends in part on how busy the server was.
This is not a setting you can turn off. OpenAI’s chat completions API reference documents a seed parameter for reproducible outputs and states plainly that it is a best effort and that determinism is not guaranteed. That is the developer-facing version of the product, with more control than any consumer interface offers.
Now add everything the consumer products layer on top. Live retrieval that pulls different pages depending on what the index served that second. Personalization and conversation memory. Location. Whether the user is logged in. Model updates that ship without announcement.
The practical consequence is that a single run of a prompt is one coin flip, not a reading. If your monthly check runs each prompt once, every number in it carries that flip.
Why does a 20-prompt monthly check tell you so little?
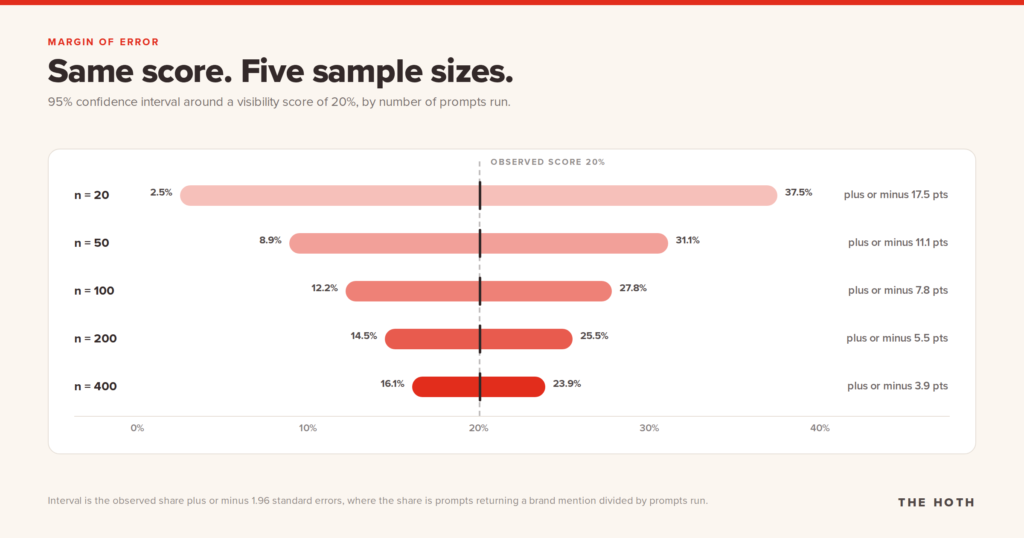
Because the margin of error on a small sample is enormous. At 20 prompts, a score of 20% carries a 95% confidence interval of roughly 2.5% to 37.5%. Almost any month-over-month change you see at that sample size is consistent with nothing having happened at all.
This part is arithmetic, and it is unforgiving.
When you run a set of prompts and count how many mention your brand, you are estimating a proportion from a sample. That estimate has a known margin of error that depends almost entirely on how many prompts you ran. Here is what it looks like for a brand appearing in about 20% of answers.
| Prompts per run | Margin of error (95%) | What a 20% score really means |
|---|---|---|
| 20 | plus or minus 17.5 points | 2.5% to 37.5% |
| 50 | plus or minus 11.1 points | 8.9% to 31.1% |
| 100 | plus or minus 7.8 points | 12.2% to 27.8% |
| 200 | plus or minus 5.5 points | 14.5% to 25.5% |
| 400 | plus or minus 3.9 points | 16.1% to 23.9% |
Read the first row again. A 20-prompt test that returns 20% is telling you the true figure is somewhere between roughly 2% and 38%. That is not a measurement you can manage against.
It gets worse when you compare two periods, because both numbers carry error and the errors compound. Comparing a 20% month to a 25% month at 50 prompts per run, the margin of error on the difference itself is about 16 points. Your 5-point gain sits comfortably inside the noise.
The sample size you would need to reliably catch a real 5-point move, meaning an 80% chance of detecting it if it exists, is roughly 1,100 prompts per period. To catch a 10-point move, about 290. To catch a 3-point move, close to 3,000.
Those numbers explain something you may have noticed already: AI visibility scores from small prompt sets tend to bounce around a lot without any obvious cause. That is not a mystery. That is what a small sample looks like.
We should be direct about our own role here. Our guide to measuring SEO and AEO success recommends building a set of 20 to 50 prompts your customers would ask and running them monthly. As a way to start looking at AI search instead of ignoring it, that advice holds. As a measurement instrument you report against, 20 to 50 prompts run once each is under-powered, and we would rather correct that here than let anyone build a quarterly reporting rhythm on it.
How does your prompt set decide the score before you run it?
Because the prompt set is usually written by the brand being measured, and it is easy to write a list that flatters you without meaning to. Your score is a property of your prompt list at least as much as it is a property of your visibility.
Sample size is the part you can calculate. Prompt selection is the part that quietly decides the answer.
Nobody sets out to rig their own reporting. But when a marketer sits down to write 30 prompts a customer might ask, the prompts that come to mind are shaped by what the brand already does well. You write around your strongest product. You use the phrasing your category page uses. You skip the comparison queries where you know a competitor owns the answer.
The result is a set that returns a number that is real for that set and misleading for your category.
Three specific distortions show up constantly:
- Branded prompts inflate everything. Any prompt that includes your company name will cite you at a rate near 100%. A handful of those in a 30-prompt set can move the headline score by 10 points or more on their own. Track branded and unbranded prompts separately, always.
- Head terms and long-tail terms behave differently. Broad category questions get answered from a small set of high-authority sources. Specific, narrow questions have more room for a smaller brand to surface. A set weighted toward one or the other produces a very different score, and shifting the weighting between periods produces a change that looks like performance.
- The set drifts. Somebody adds five prompts this quarter and drops three that were not relevant anymore. The score moves. You now cannot separate the effect of your work from the effect of the edit.
The fix is unglamorous. Freeze the prompt set and version it, so that when it changes you know exactly when and can report before and after. Build it from real query data rather than imagination, using prompt volume data where your tools offer it. Split it into named groups, at minimum branded versus unbranded and commercial versus informational, and report each group separately. And include two or three competitors in every run, because a competitor score moving in the same direction as yours in the same period tells you the engine changed, not your marketing.
That last one is the single highest-value addition most reporting is missing. A control gives you something to compare against when the whole category shifts at once.
Why do two tools report two different numbers for the same brand?
Because they are measuring different things across different engines, and the engines themselves disagree about who deserves a citation. Blending several platforms into one score hides the only information you can act on, which is which engine moved.
Run your brand through two AI visibility platforms in the same week and you will very likely get two different scores. That is not necessarily either tool being wrong. They differ in prompt sets, in which engines they cover, in geography, in whether sessions are logged in, and in whether a plain brand mention counts the same as a linked citation.
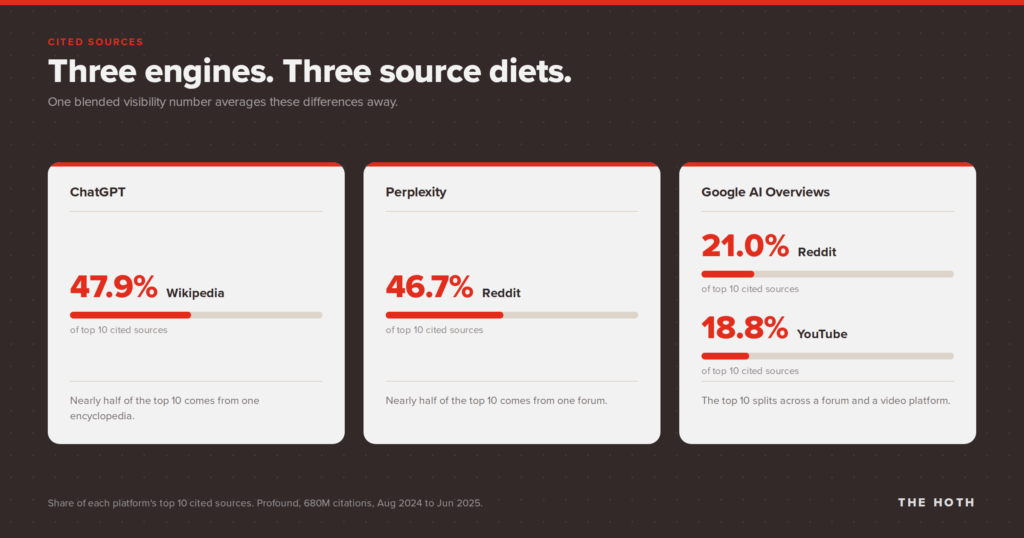
Underneath the tooling differences, the engines are drawing from substantially different pools. Profound’s analysis of 680 million AI citations found that within each platform’s ten most-cited sources, ChatGPT’s share was dominated by Wikipedia at 47.9%, Perplexity’s by Reddit at 46.7%, and Google’s AI Overviews spread more evenly across Reddit at 21.0% and YouTube at 18.8%.
Those are different source diets, which means they are different games. A brand with strong encyclopedic and editorial presence can look excellent on one platform and invisible on another, and a single blended score averages that distinction into mush.
The practical rule: never report one AI visibility number. Report a number per engine, and treat a blended figure as a headline only, never as the thing you diagnose from. If your score drops and you cannot say which engine it dropped on, you cannot act on it.
Worth noting that the Profound dataset covers a window ending in mid-2025, and platform behavior in this space moves quickly. Treat the specific percentages as an illustration of how far apart the engines sit rather than as an exact split for today.
What does a number you can defend look like?
It has a denominator, a date range, a named engine, and a stated margin of error. Wherever possible it is a count from a census rather than a percentage from a sample, because counts do not carry sampling error at all.
The strongest move available to you is to stop relying on sampled percentages where a complete count exists.
Some of your AI visibility data is census data. It covers everything, not a sample of it. Referral sessions from AI platforms in GA4 are census data. Keyword-level AI citation counts pulled from an index, the kind Ahrefs and similar tools expose, are census data across their tracked keyword universe. These have their own coverage limits, and they undercount platforms that send no referrer, but they do not bounce around because you happened to run 30 prompts instead of 40.
This is why our case studies report citations as counts. When we published results for a beard grooming brand, the AI figure was over 70 citations earned across platforms including ChatGPT and Google’s AI Overviews during a three-month campaign, alongside 97 keywords in the top three positions and a nine-point Domain Rating gain from a starting point of 8. Over 70 citations is a count from a tracked set. It does not need a confidence interval, and it does not change if somebody edits the prompt list.
A percentage without a denominator is a claim. A count with a date range is evidence.
So the reporting hierarchy looks like this. Lead with counts and referral data, because they are the most defensible. Use sampled prompt scores for the thing they are uniquely good at, which is competitive share of voice, since you cannot get a competitor analytics account. And when you report a sampled score, report it as a range.
How do you rebuild your AI visibility reporting?
Freeze and version your prompt set, run each prompt several times per period rather than once, report per engine, pair sampled scores with census counts, include competitors as a control, and compare quarters rather than months.
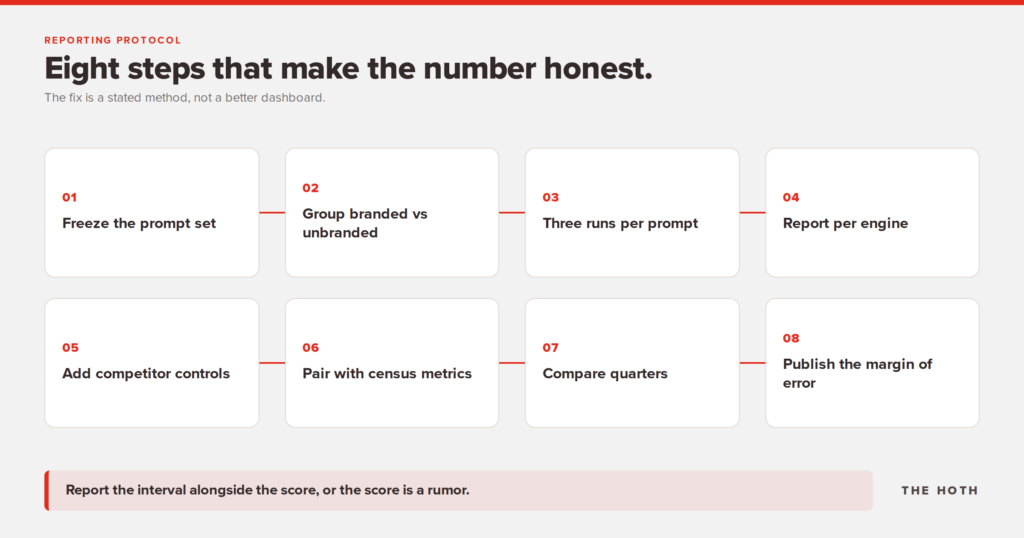
Here is the protocol, in the order you would implement it.
1. Freeze and version the prompt set. Write it down, date it, and give it a version number. Build it from real query data where you have it. Aim for 100 prompts at minimum if you intend to report on the score, and understand that at 100 you can see 10-point moves and not much finer.
2. Group the prompts and report each group. Branded and unbranded at a minimum. Add commercial and informational if your volume supports it. Never let branded prompts sit inside the headline number.
3. Run each prompt at least three times per period. This is the step that addresses run-to-run variance, and almost nobody does it. Record the mean and the spread. If a prompt cites you on two runs out of three, that is a more honest data point than a single yes or no.
4. Report per engine, never blended alone. ChatGPT, Google AI Overviews, Google AI Mode, Perplexity, and Gemini get their own lines. A blended headline is fine on top of those, not instead of them.
5. Include two or three competitors in every run. They are your control group. When everyone moves together, the platform changed.
6. Pair every sampled score with a census metric. AI referral sessions in GA4 and indexed citation counts. When the two disagree, trust the census.
7. Compare quarters, not months. Given the sample sizes most teams can run, a month is not enough time for a real change to clear the noise. Quarterly comparison gives you a bigger effective sample and a shot at seeing something true.
8. Publish the margin of error next to the score. One line: 22%, plus or minus 8 points, n=100 prompts, three runs each, ChatGPT only. That sentence is worth more than any dashboard.
None of this is exotic. It is standard survey methodology applied to a channel that skipped the step.
Where does managed measurement fit?
If you are running this yourself, the protocol above is the whole job. If the volume is beyond what your team can sustain by hand, the measurement layer is something you can buy alongside the work that moves the number.
Running 100 prompts, three times each, across five engines, monthly, with competitors included, is 1,500-plus queries a month logged and coded by hand. That is a real job. Most teams start it and stop by month three.
That is the gap AI Discover is built to close. The tracking side handles citation frequency, topic coverage, and competitor benchmarking on an ongoing basis, and it sits alongside the work that changes the number rather than separate from it: earned coverage, content updates, and reputation signals. Our guide to AI visibility reporting walks through the KPI framework in more detail if you want to build the stack yourself first.
The honest pitch is not that a managed program makes the noise disappear. It is that consistent methodology, run the same way every period, is what makes a trend readable at all. The single biggest source of fake movement in AI visibility reporting is a method that changed between measurements.
The bottom line
Your AI visibility number is probably not fabricated. It is reported with a precision it does not have. Fix the method, not the dashboard: widen the sample, repeat each prompt, split by engine, add a control, and put a range around the number.
Three things are true at once. The same prompt gives different answers on different runs, for reasons rooted in how inference servers work. Small prompt sets carry margins of error far larger than the changes people report on them. And the prompt set itself, chosen by the person being measured, shapes the result before the first query runs.
The response is not to stop measuring. AI search is sending real buyers, and the brands that measure it badly will still beat the brands that ignore it. The response is to measure it like a sample, because that is what it is.
Do that and you get something better than a bigger number. You get a number you can defend when somebody asks what changed.
If you want to see where your brand currently stands across AI platforms before rebuilding your reporting, book a call with our team and we will walk through your current visibility and the method behind it.
Frequently Asked Questions
How many prompts do I need for a reliable AI visibility score?
It depends on how small a change you need to detect. At 100 prompts you can see roughly 10-point moves. Catching a 5-point move with reasonable confidence takes around 1,100 prompts per period. If you are reporting on a set of 20 to 50, treat the result as a directional signal and not as a metric precise enough for month-over-month comparison.
Why does ChatGPT mention my brand one time and not the next?
Because production language models are not deterministic. Research from Thinking Machines Lab found that the same prompt run 1,000 times at temperature zero produced 80 different completions, driven by how inference servers batch requests rather than by anything about your content. Live retrieval, personalization, and location add further variation on top.
Should I trust the score from my AI visibility platform?
Trust it as one input, and ask three questions about it: how many prompts, how many runs per prompt, and which engines. A score without those three numbers attached cannot be interpreted. Different platforms reporting different scores for the same brand is expected, not a sign that one is broken.
Is AI referral traffic a better metric than a citation score?
For measuring outcomes, yes, because it is a complete count rather than a sample and it connects to conversions. Its limitation is coverage, since some platforms send little or no identifiable referrer data. The strongest reporting pairs both: referral and conversion data for outcomes, sampled prompt scores for competitive share of voice.
How often should I report AI visibility?
Collect monthly so you have the history, but compare quarter over quarter. At the sample sizes most teams can sustain, month-over-month changes are usually inside the margin of error, and reporting them as performance creates pressure to explain movement that has no cause.
Leave a comment