In early 2018, Google released an SEO tool called Lighthouse that offers insight on how to improve the quality of your pages. The Google Lighthouse audit is an open-source automated tool that checks a page’s performance, accessibility, and more.
There are a few ways web developers can implement these audits and even more ways that this new Google tool is changing the game of SEO. Let’s take a look:
What Is The Google Lighthouse Audit Tool?
Google Lighthouse is a webpage auditing tool that gives insights into a page’s performance, SEO, usability, and accessibility. It’s free to install and can be used on any public webpage.
What the Tool Checks
So what exactly are these reports that the Google Lighthouse audit provides? The audit reports on a few key factors for each web page, which are:
- Overall performance
- Accessibility
- Best practices
- Progressive web applications
The report details how visitors interact with these different elements of the page and what issues need fixing.
Anyone Can Use and Understand It
Analytics software can prove confusing for even the most knowledgeable performance experts. If you can’t understand the report, you can’t make the necessary changes. This is extremely frustrating for site designers, especially if they know their site needs improvement but they can’t figure how why or how to achieve it. The Google Lighthouse audit takes the guesswork out of issues with page performance and offers a clear solution.
Not Just for Developers
Improving page performance goes hand-in-hand with improving the visitor experience. When web developers learn what areas of their page need work, they can make the necessary changes and inadvertently, improve the browser experience.
It’s an Upgrade
Although the Google Lighthouse audit feature is new, the Audit’s panel has actually been around for some time. This was before version 60 of Chrome was introduced. It’s important to note that these audit reports are only done using the Chrome browser.
The former audit panel has been updated with the Lighthouse tool, creating a completely different user experience. In the past, users had the option of using the Lighthouse tool in the older version of Chrome, but now, it’s conveniently located directly in the browser. Essentially, the Audit’s panel is powered by Lighthouse.
How To Install Lighthouse
There are a few options to get access and install the tool:
Chrome DevTools
This may be the simplest option when it comes to running the Google Lighthouse audit. Chrome DevTools is the easiest way to run audits on pages that require authentication. Reports are provided in a user-friendly format, as well.
1. You’ll need to download Google Chrome for your desktop, if you don’t already have it.
2. Once downloaded, simply type the URL you want audited into the search bar.
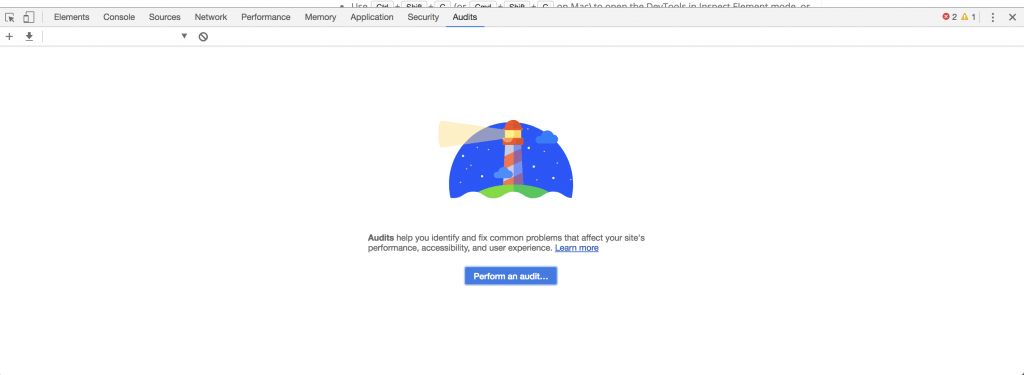
3. Now open your Chrome DevTool by going right clicking on any page and selecting “inspect element”
4. Click on the Audit tab to access Google Lighthouse. Enable all categories offered and click “run audit”.
The beauty of this method is that you’ll receive your audit report within 90 seconds or less! And you don’t have to search for the report either. It will show up directly in your current browser window.
Node Command Line Tool
Another option for using the Google Lighthouse audit tool is to install and run the Node command line tool. After installing the Node tool, you’ll need to download Google Chrome from your desktop. Next, install the long-term support version of Node. The last step is to install the Lighthouse tool.
The – g flag will install it as a global module. To run an audit, use “lighthouse <url>”. To view your audit options, use “lighthouse — help”. You also have the option to run Node module programmatically.
Chrome Extension
The last option for running audits using the Google Lighthouse tool is to run it as a Chrome extension. This option is virtually the same as using the Chrome DevTool, except you’ll need to install the extension. If you don’t have a specific reason for doing so, using the Chrome DevTool workflow is the more convenient option.
For this process you’ll also need to download Google Chrome for your desktop and then install the Lighthouse Chrome Extension from the Chrome webstore. The audit process is fairly simple.
Using Chrome, visit the page that you wish to audit. There should now be a small lighthouse icon next to the address bar. Click this. If it’s not there, open the Chrome main menu and you’ll see it at the top of the page. After clicking the lighthouse icon, the page will expand.
Next, click “generate report”. The Google Lighthouse audit tool will run it’s report in the current window and automatically open a new tab with the results.
How Google Lighthouse Audit Works
Regardless of how you choose to run the Google Lighthouse audit, the results will be the same. You provide the tool with a URL and it runs a series of checks before generating a detailed report and scores on how well the page performs.
Users can take this information and examine any failing indicators, creating a blueprint for improvements. Another awesome feature of the Google Lighthouse audit is that users receive a reference doc upon completion that explains exactly why the audit was important and how to make necessary changes. You can also share these reports.
Lighthouse Viewer
The Google Lighthouse audit comes with a viewer option, which allows you to view and share your reports online. Depending on which Lighthouse workflow option you chose above, the Lighthouse tool needs the JavaScript Object Notation (JSON) output of your Lighthouse report to enable sharing. This file format uses human-readable text to transmit data objects.
Another option is to share your reports as GitHub Gists, which allows for free version control.
A Closer Look at the Tests
We mentioned that the Google Lighthouse audit tests for performance, accessibility, best practices, and progressive web applications, but what exactly does that mean? Let’s take a closer look at each component.
Performance
You already know that the speed with which a web page loads is of extreme importance for users. As the time it takes for your web page to load increases, so does the likelihood that your visitor will abandon their search. Your Lighthouse performance report helps with this.
The Lighthouse audit provides site performance reports under several categories including metrics, opportunities, and diagnostics. Metrics covers three main points of the loading process, showing you which page features are slowing things down.
Next, you’ll be presented with suggested opportunities for speeding up the application. These suggestions include link and image compression, as well as optimizing other resources. And finally, the performance component of the Google Lighthouse audit also offers diagnostic information.
The diagnostics of a page include reducing the length of chains required for page loading and deferring the downloading of unnecessary resources.
Accessibility
This feature of the Google Lighthouse audit examines the behaviors of nontraditional users. Accessibility is geared toward visitors who suffer some sort of disability or impairment. This portion of the audit tool analyzes the screen reader and other assistive technologies on the page.
Best Practices
We already know that Google has a lot of rules. This element ensures that web developers are following the rules and implementing best practices when it comes to web design. This feature also helps users avoid performance pitfalls and modernize the pages.
Progressive Web Applications
Progressive web applications (PWA) are rated based on three key factors – speed, reliability, and engagement. The Lighthouse audit helps developers take a PWA from baseline to exceptional by providing a checklist of features.
Users will see a list of tests that the PWA has failed and ways to fix these issues. Next, you’ll see which portions of the test your PWA passed. Manual checks are also run but do not affect your overall score.
Understanding the Architecture
If you want a deeper understanding of exactly how the Google Lighthouse audit performs its job than this next section is for you. There are certain components to the audit that allow it to gather the necessary data and information for reporting.
- Driver – Interfaces with Chrome’s debugging tools
- Gatherer – Uses the driver to collect information and create artifacts
- Audits – Use the artifacts to test and assign scores
- Categories – Group the audit results together and provides a weighted score
It takes all of these steps, together, to produce the detailed reports that this innovative SEO tool has to offer.
Google Lighthouse Audit is Changing the SEO Game
This is the first time, in a long time, that web developers are getting an upper hand on SEO. The Google Lighthouse audit is taking a lot of the guesswork out of web development and performance. With detailed reports, you’ll know exactly which aspects of your site are working for your and which are working against you.
With this knowledge, developers can take a different approach to SEO. Redesigning and updating your site based on these results means improved speed, traffic, and visitor retention – all things that improve your chances of getting the most out of your SEO practices.
Leave a comment