The internet is bursting at the seams with content, and the battle for your target audience’s attention wages fiercer than ever before.
Besides content from your brand, your audience gets flooded with countless emails, blogs, videos, and podcasts from others.
Yet, there’s still one surefire way to grab your audience’s attention, and that’s with visual content.
Humans are largely visual creatures, as we retain 65% of the information we see, compared to only 10% of what we hear.
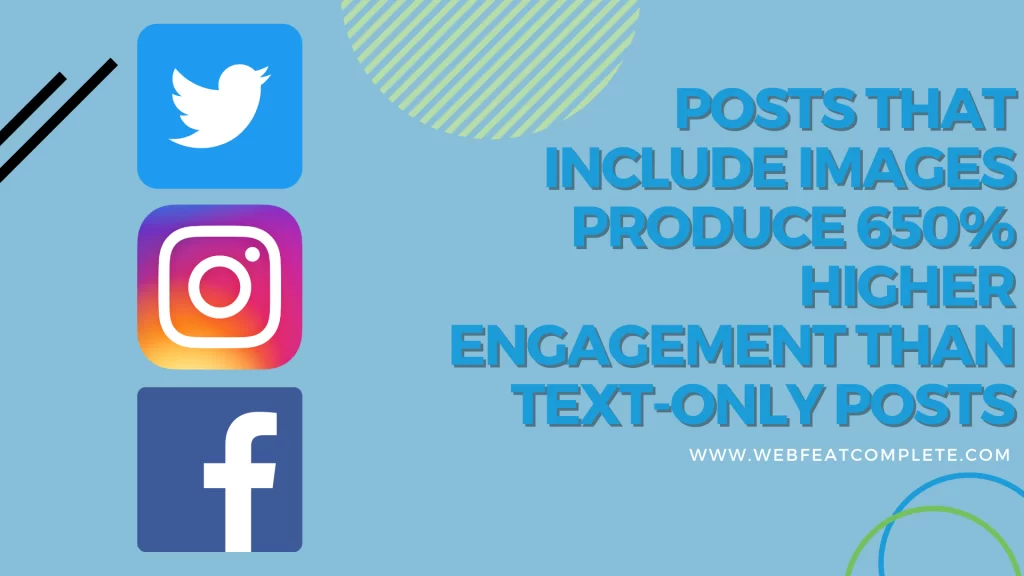
Accordingly, content like videos and infographics generates 650% more engagement than static content that contains only text.
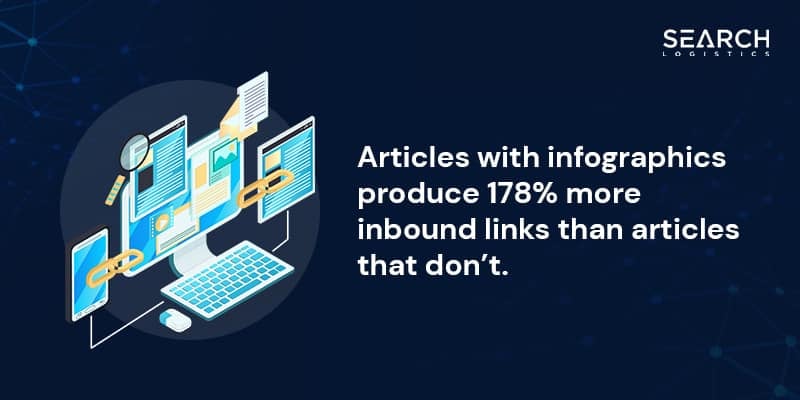
If you want your content to generate lots of backlinks without having to conduct outreach, infographics are even more important.
That’s because blogs containing infographics produce 178% more backlinks than ones that do not.
So, if you haven’t been producing infographics for your SEO content, you’re missing out on lots of traffic, social shares, and backlinks.
The good news is infographics are an incredibly diverse content medium, so they can apply to virtually any industry or niche. They’re simply visual representations of a data set or piece of information, and they’re excellent for conveying complex concepts in easily digestible, eye-catching ways.
In this article, we’ll teach you how to harness the SEO power of infographics for greater online visibility, so stick around.
What are Infographics?
The word infographic is short for information graphic and is a way of conveying data or information visually. Infographics use a combination of charts, graphs, images, and minimal text to present complex topics in visually engaging ways.
For instance, you could write a 1,000-word blog post explaining how to operate a hedge trimmer, or you could greatly simplify things by creating a detailed infographic breaking down each step.
Infographics are extremely powerful communication tools for this reason, as they help audiences quickly grasp concepts through the aid of compelling visuals.
Here are a few examples of common elements found in infographics:
- Images
- Icons
- Text
- Charts
- Graphs
- Diagrams
- Maps
- Graphics (people, places, things, etc.)
Here are the top characteristics of engaging infographics:
✨Clarity: The message should be clear and easy to understand.
✨Engagement: The design should be aesthetically pleasing and hold the viewer’s interest.
✨Accuracy: The information must be correct, reliable, and up to date.
✨Simplicity: Use visuals to break up complex data in a way that’s easy to grasp.
✨Visual Appeal: Color, layout, and typography should enhance understanding and retention.
| Studies have shown that using colors in visuals can increase readers’ attention spans and recall by 82%. |
Different types of infographics
As stated before, infographics are an incredibly diverse type of content that can take on many different forms.
You can use infographics to break down statistics, cover a timeline, map out directions, and provide step-by-step guides on how to do something – just to name a few.
Here’s a look at the most popular types of infographics.
Statistical infographics
A statistical infographic visualizes sets of data with charts, graphs, and numbers to provide clear, easy-to-digest insights.
Statistical infographics are one of the most reliable ways to generate backlinks since bloggers and digital marketers are always on the hunt for relevant stats to use in their content.
Therefore, if you can centralize a bunch of relevant industry statistics into one visually pleasing infographic, you can bet that writers and marketers will link to it like gangbusters.
Nearly every industry has important statistics that readers and marketers need to know, from the effectiveness of email marketing campaigns to following OSHA guidelines and beyond.
| Pro tip: Ensure that the statistics you include in your infographics are up to date and come from the most trusted sources online. If you haphazardly include every stat you can find, you risk misinforming readers, which will negatively affect your brand’s reputation. |
Informational infographics
Sometimes, the purpose of an infographic is purely to educate your audience. Defining key terms, outlining complicated concepts, and explaining industries are all ways you can use informational infographics.
For example, the digital marketing world is filled to the brim with confusing jargon and acronyms, which are perfect candidates for informational infographics.
You could create a visual aid breaking down acronyms like SEO (search engine optimization), PPC (pay-per-click), and other digital marketing terms.
Just remember to include as many visual elements as possible to ensure the infographic isn’t too text-heavy.
Timeline infographics
Do you want to educate your viewers on the history of the desktop computer?
If so, a timeline infographic is the perfect type of content to make it happen. These types of infographics map out historical events, trends, or milestones in a visually appealing format.
Once again, be sure to include as many visual elements as possible to cut down on the amount of text.
Map infographics
Maps make excellent templates for infographics, even if the information you want to convey isn’t geographical.
For instance, you could use a visual map of the United States to double as a timeline of sorts, highlighting different historical events in different areas around the country.
Of course, you can also use map infographics to highlight routes, locations, and other geographical points of interest.
Comparison infographics
These types of infographics compare two sets of data, most commonly comparing two products, services, or concepts.
A comparison infographic is the perfect type of content for commercial intent keywords, which are search terms that represent commercial intent (i.e., the user is doing research to make a purchase).
Instead of having to sit down to read a 5,000-word blog post comparing your service with another, why not create a simplified infographic that does the same thing?
Comparison infographics provide users with quick, easily digestible ways to compare products and services.
How-to infographics
Lastly, you can use infographics to teach your audience how to do something in a step-by-step format.
The sky’s the limit here, as you can create a how-to infographic for just about anything. From learning how to tie your shoes to breaking down how to file taxes, how-to infographics are extremely versatile and effective.
Just like statistical infographics, how-to’s are great for generating lots of backlinks and shares on social media.
If your goal is to generate backlinks and build brand awareness, how-to infographics, and statistical infographics will be your best friends.
Why Are Infographics Important for SEO?
Play your cards right, and infographics will be your ticket to higher search engine rankings, better brand awareness, and loads of organically generated backlinks (which are the best kind, by the way).
If you want your infographic to stick in your audience’s minds, demand their attention, and persuade them to take a certain action, you must make proper use of:
- Color
- Negative space
- Graphics
- Copy (short and to the point)
- Fonts
- Structure (a beginning, middle, and end)
It’s crucial for your infographic to have some sort of conclusion; otherwise, it will feel incomplete.
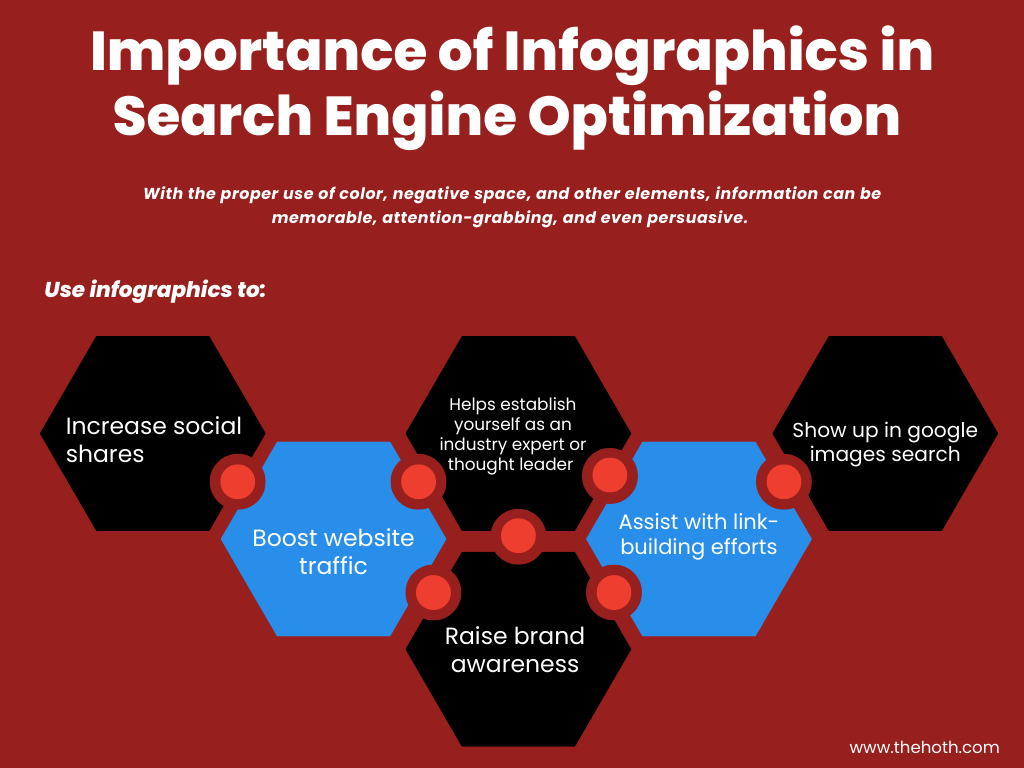
You can use infographics to:
- Increase social shares
- Boost website traffic
- Raise brand awareness
- Assist with link-building efforts
- Show up in Google Images search
- Help you establish yourself as an industry expert or thought leader
In fact, infographics are the #1 way digital marketers can present data or information in a graphic, visual manner.
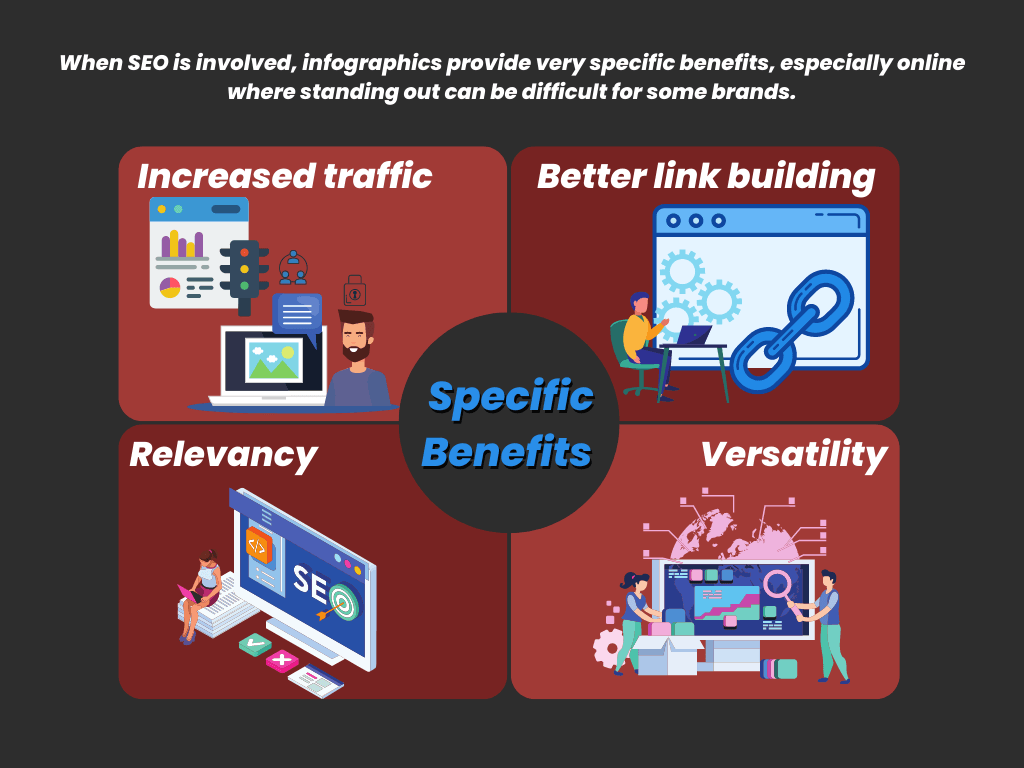
In terms of SEO, infographics provide some very specific benefits, especially for brands that have trouble standing out from the competition.
Specifically, these benefits are:
- Boosted organic traffic
- Improved link-building
- Achieving thought leader status
- Relevancy
- Versatility
You should tailor each infographic to the specific wants, needs, and desires of your target audience. If it catches on, it’ll work wonders for your brand’s online visibility.
According to Search Engine Journal, the two most important ranking factors for Google are the quality of your content and link-building efforts.
However, that doesn’t stop link-building from being one of the most challenging aspects of SEO. Building high-quality links takes countless hours of conducting research, writing guest posts, and finding broken links – just to name a few tactics.
The good news?
Infographics are a great way to simplify the link-building process.
Bloggers, marketers, and influencers are constantly on the lookout for relevant content to share, link to, or retweet. If you’re able to tap into the minds of your audience and produce an infographic that touches on the topics they’re writing about, you’ll start generating backlinks left and right.
The best part is you won’t have to conduct any email outreach to build these links. Instead, online users will start linking to your content due to its pure merit and quality (which is the way Google wants you to build links).
The best infographics have some real staying power, too, as they can circulate on the internet for years.
Try to think of unique angles for approaching common topics in your niche. The more original your infographics are, the more likely it is that they’ll catch on and continue generating links for quite some time.
Also, with a clever content marketing strategy, you can repurpose one infographic into many different pieces of content (i.e., a blog post and video covering the same topic).
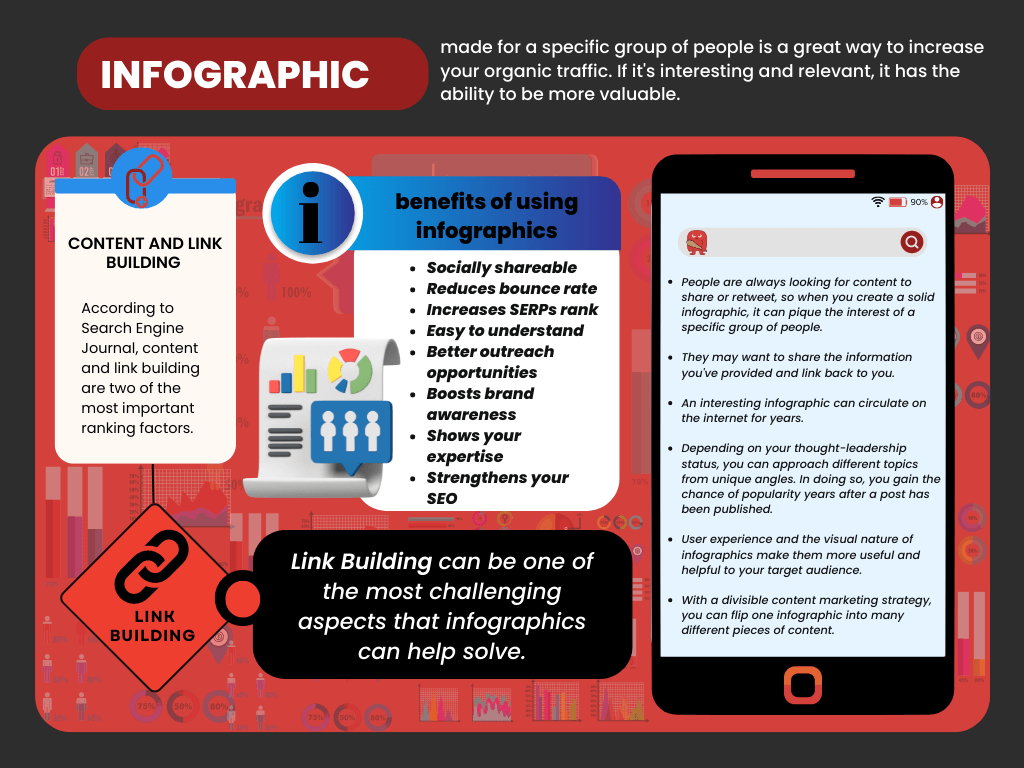
Here are some other benefits of using infographics in your content:
- Highly shareable on social media
- Reduces bounce rate
- Increases SERPs rank
- Easy to understand
- Better outreach opportunities
- Boosts brand awareness
- Shows your expertise
- Strengthens your SEO
Are you still not sure if you should invest time and money into creating infographics?
If so, then you should take a look at the following reasons why infographics are integral for modern SEO campaigns.
Increased traffic and engagement
Infographics use color, design, and negative space to present information in a memorable and visually appealing way.
This leads to increased social shares, higher website traffic, and better user engagement.
Backlinks and authority
High-quality infographics are likely to be shared and linked to from other websites.
These backlinks signal to search engines that your content is valuable and credible, making it more likely for your content to rank higher (considering the rest of your SEO is on point).
Improved link building
One of the most challenging aspects of SEO is building quality backlinks.
When you create compelling infographics, people are more likely to share them and link back to your website as the original source – meaning you’ll generate links without having to lift a finger.
Search engine visibility
Infographics will help you show up in Google Images search results, offering another avenue for people to discover your content.
Content versatility
A single, well-designed infographic can be repurposed across your digital marketing strategy. Use it in blog posts, break it into smaller social media visuals, or include it in presentations.
Establish thought leadership
Infographics help you present complex topics in an easily understandable format.
This positions you as an industry expert and a reliable source of information, causing your audience to trust you as an authority figure in your field.
If that wasn’t enough, here are some more benefits of infographics for SEO:
Reduced bounce rate and better dwell time: Engaging visuals keep visitors on your site longer, reducing bounce rates and extending dwell times.
Better outreach opportunities: Infographics make compelling content to pitch to websites or bloggers for guest posts, further expanding your backlinks.
How Do I Create an Infographic for SEO?
Let’s use David McCandless as an example here. He’s the author and creator of Information is Beautiful and has done a good job of using visuals to explain what an effective infographic or data visualization looks like.
With that said, he incorporated four elements into his project.
Here are the four best practices for infographic and data visualization:
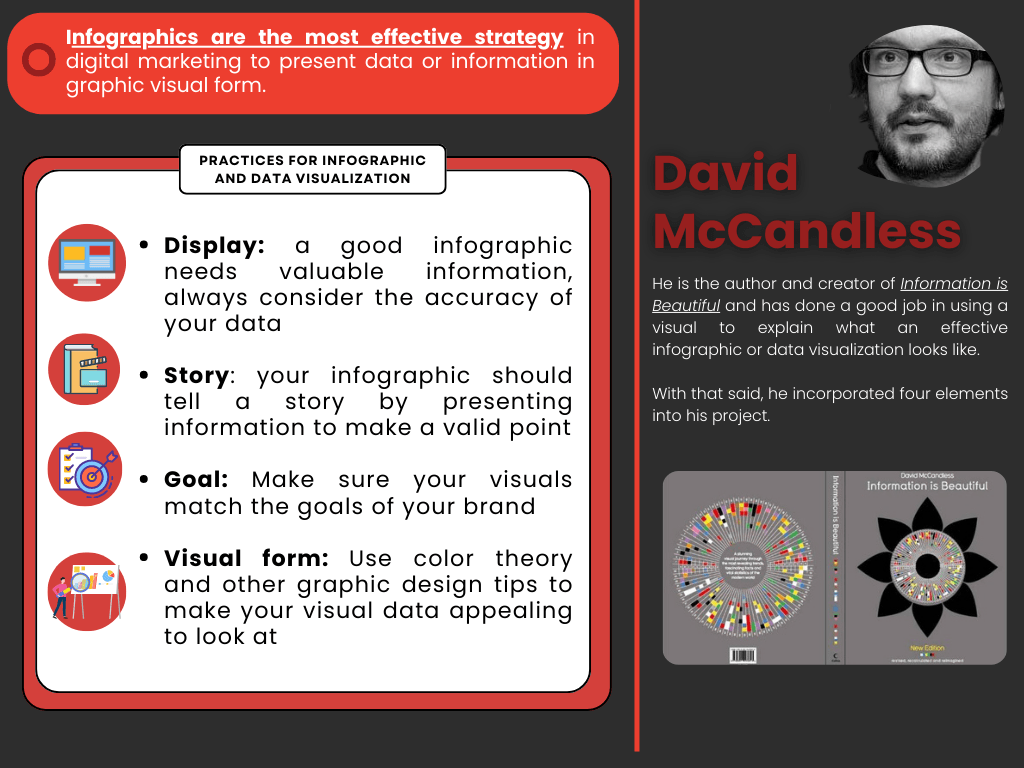
- Display: A good infographic needs valuable, accurate information.
- Story: Think of your infographic as a mini-narrative that contains a clear beginning, middle, and end.
- Goal: Besides the presentation of information, what is the reason you want to create an infographic? Make sure your visuals match the goals of your brand.
- Visual form: Is your infographic easy on the eyes, or does it burn your retinas? Use color theory and other graphic design tips to make your visual data appealing to look at.
8 Steps to Create SEO-Friendly Infographics
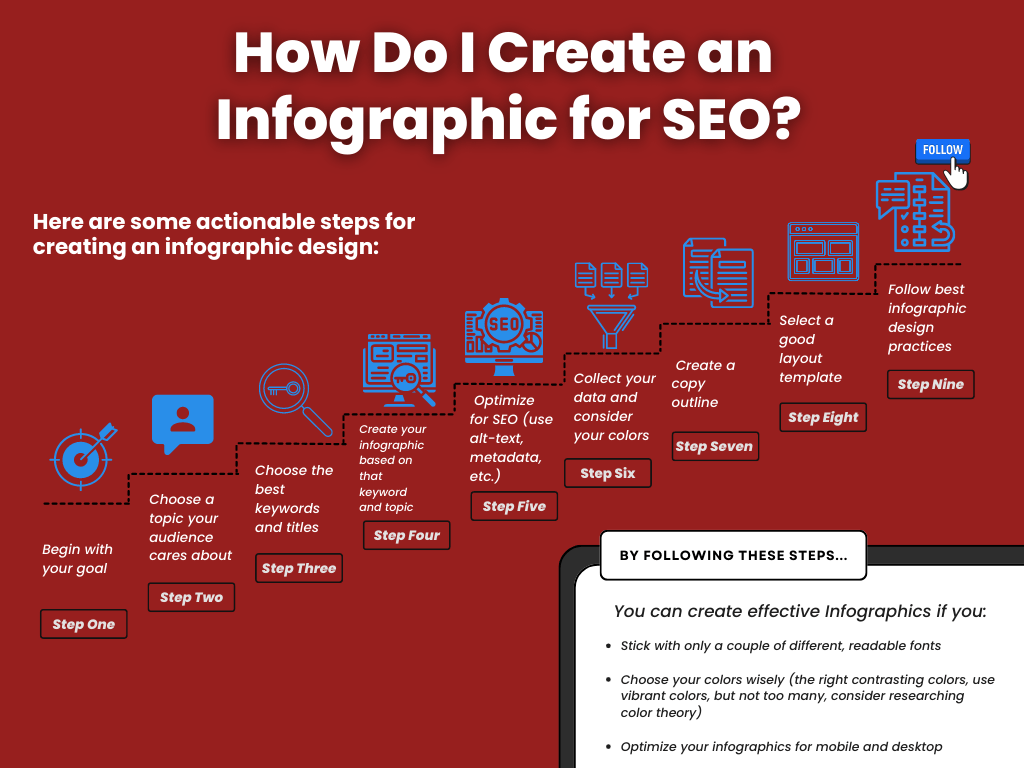
Here are some actionable steps for creating an infographic design from scratch:
Step 1: Begin with your goal
What do you ultimately want to achieve from creating an infographic? Do you want to generate lots of backlinks, or is establishing your brand as a thought leader more important?
Your goal will inform the style of infographic you create (such as creating statistical infographics to generate lots of links), which is why you need to define it first.
Step 2: Choose a topic your audience cares about
Pick a topic that your target audience is passionate about; otherwise, interest in your infographics will fizzle out before you know it.
Research your audience by building a buyer persona (if you haven’t already) that encompasses your audience’s pain points, desires, habits, and demographics.
Step 3: Choose the best keywords and titles
Your keywords are how you appear in relevant user searches, so you should conduct thorough keyword research for your infographics.
Try to find keywords that relate to each topic that feature high search volume yet low competition. You can use our free keyword planner tool to help you identify the best keywords to use.
| Why do I need to do keyword research for an infographic?
Keyword research is essential for creating SEO-optimized infographics that attract the right audience. When creating an infographic, target the same keywords you would for blog posts and other content to ensure your infographic aligns with your overall SEO strategy. ✨Tools like the HOTH Google Keyword Planner assist in finding relevant keywords that people are actively searching for. |
Step 4: Create your infographic based on that keyword and topic
Once you know which keywords to use, structure your entire infographic around it and the topic it relates to.
Yet, it’s important not to spam your keywords, as that’s never a good idea (and it ruins the user experience for your infographic), so use them sparingly.
Step 5: Optimize for SEO (use alt-text, metadata, etc.)
Don’t forget to add crucial SEO tweaks like using your keywords in the metadata. Also, you should write a few lines of alt text for the infographic.
What’s that?
Alt text serves two purposes, as it helps the visually impaired, and it lets Google’s bots know what your image displays (the bots lack computer vision).
As such, don’t forget to include your target keyword in the alt text.
Step 6: Collect your data and consider your colors
Next, collect all the data that you’ll use for the infographic (statistics, facts, images, graphics, etc.) and store it in one location for convenience.
Also, decide on the color scheme that you’ll use. Ideally, your color scheme should be visually appealing and align with your brand’s colors.
Step 7: Create a copy outline
Create a brief outline that describes the infographic. This is the copy that you’ll use to supplement the visuals.
Remember that less is more for text copy in infographics. It’s a visual medium, so do your best to show, not tell.
Step 8: Select a good layout template
There are plenty of infographic templates out there, so do your best to choose one that suits the topic.
Here are some free infographic templates you can use from Canva.
Follow best infographic design practices
There are more than a few best practices you should follow when designing your infographics, some more intuitive than others.
Here’s an overview of the top infographic best design practices to consider.
Content and planning
- Clear focus. Make sure you know your topic and have a clear message ready for it. Don’t overload your infographic with information, as that defeats the point.
- Target audience. Consider the needs of your target audience, especially in terms of tone, color scheme, and the infographic’s visual layout.
- Accurate data. Double-check that all the stats and figures you include are accurate and up to date.
- Storytelling. Follow a narrative structure (beginning, middle, and end) for your infographic.
- Outline. Before you get started, create a simple outline to ensure the infographic has all the necessary elements and a logical flow.
Visual Design
- Visual hierarchy. Structure the infographic so that the viewer’s eye catches all your most important points.
- Readable fonts. Go with fonts that are easy to read, and use visually pleasing color schemes (i.e., don’t use bright colors).
- Color palette. Speaking of color, ensure the infographic’s color scheme aligns with your brand and complements the topic.
- Charts and graphs. Choose appropriate visualizations to represent your data, such as charts, graphs, and timelines.
- Icons and images. Too much text is boring, so include fun graphics, icons, and images to break it up.
- White space. A cluttered design will overwhelm viewers, even if your infographic is sparse in text. Provide plenty of ‘breathing room’ around visual elements to avoid clutter.
Technical considerations
- File format. For the clearest visuals, choose a high-resolution file format like PNG, JPG, or SVG.
- File size. Compress your infographic so that the file size is as small as possible without losing quality. File sizes that are too large can cause your website to load slowly, which is bad news for your user experience.
- Accessibility. Don’t forget to include things like image alt text and transcripts to provide accessibility for all internet users.
Additional Tips
- Branding. Include your brand elements without overdoing them (using your logo and branded colors is enough).
- Call to action. You likely want users to complete a specific action after viewing your infographic, so spell it out for them with a clear CTA (call to action).
- Promotion. If you’re going to spend time and resources creating an infographic, you need a way to promote it to ensure it gets seen. Spend time strategizing how you’ll share your new infographic, such as posting it on your social media accounts.
Excellent infographic examples
Here are a few examples of infographics around the web that we find particularly appealing and effective (and they can help get your creative juices flowing):
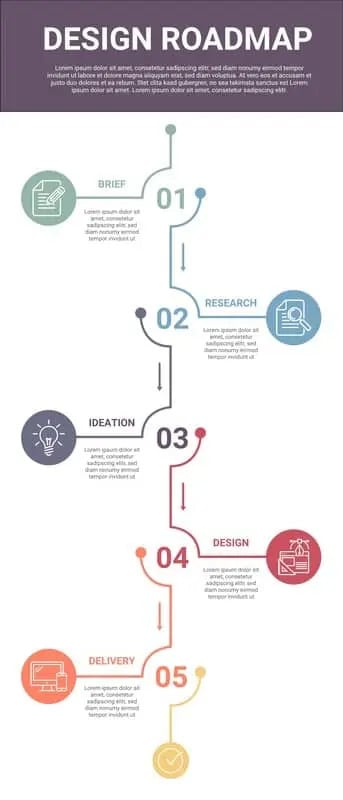
This infographic’s simplicity is also its greatest strength. It makes excellent use of a timeline and uses simple graphics to drive the point home.
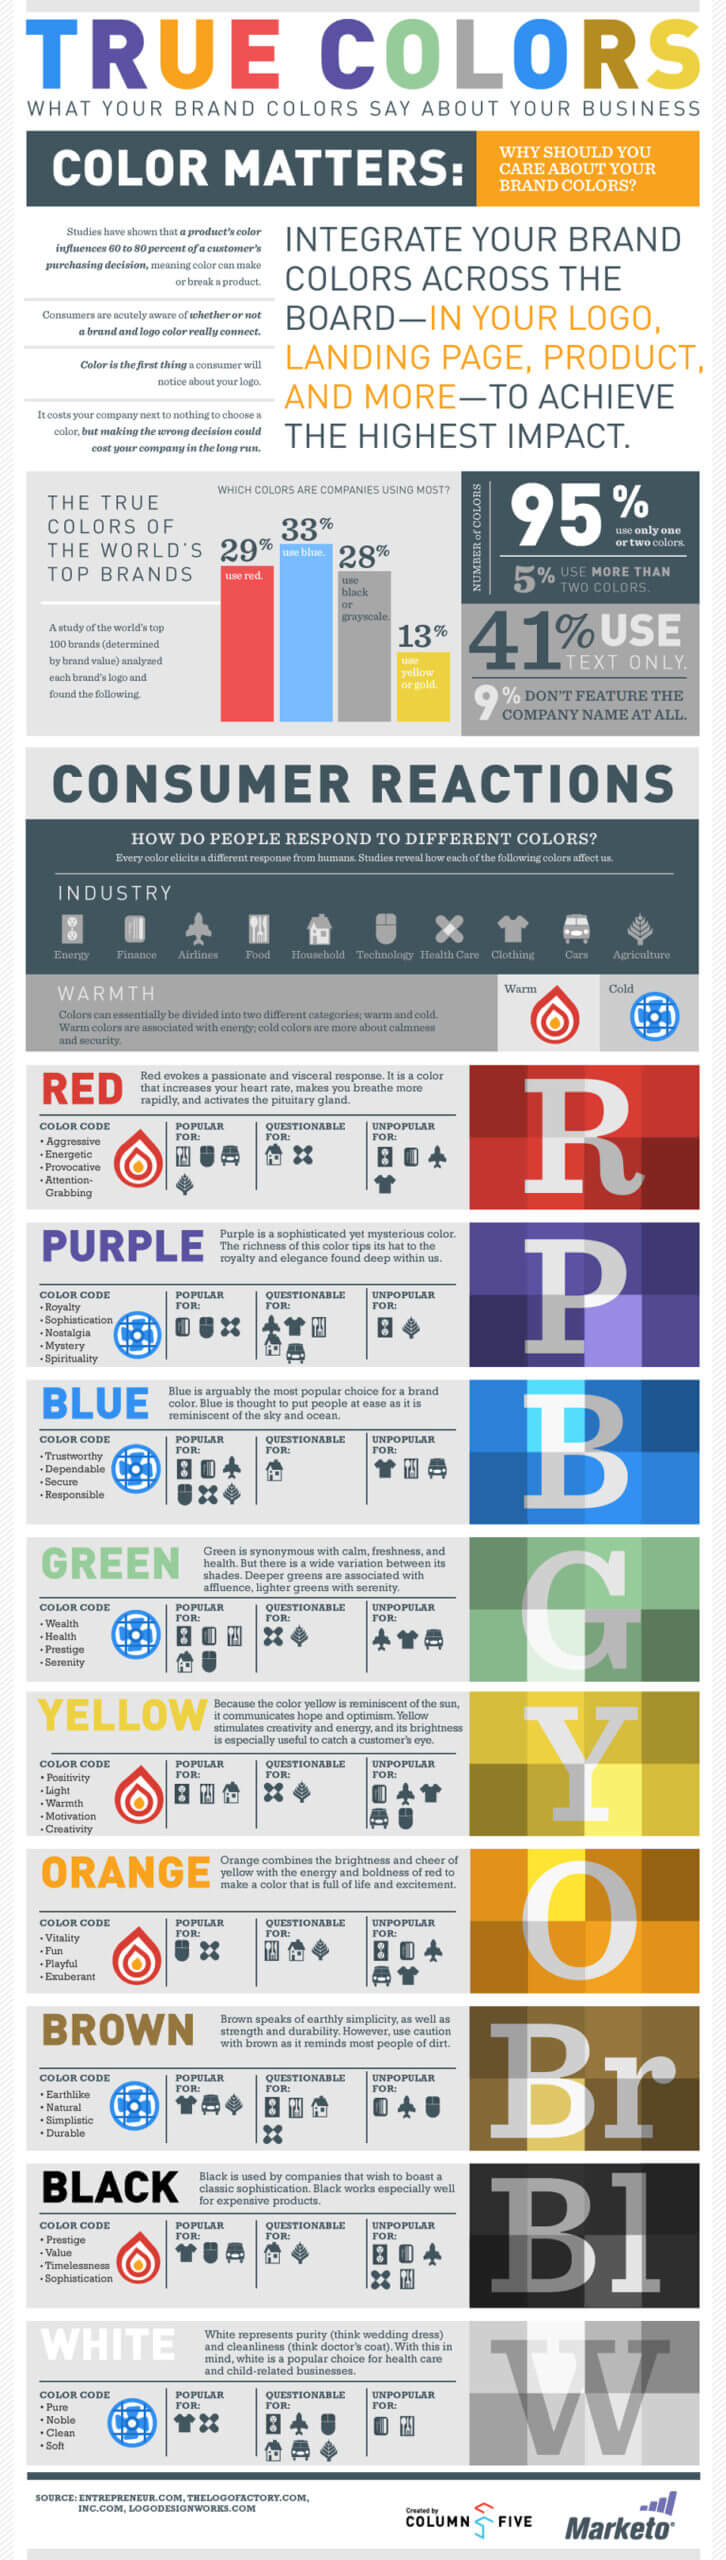
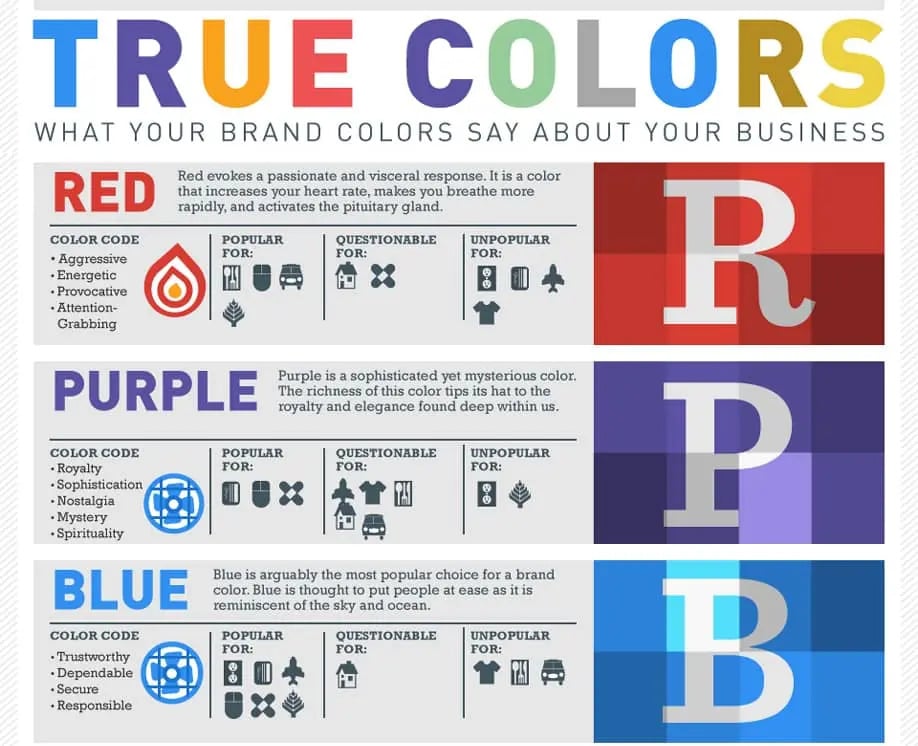
True Colors: What Brand Colors Say About Your Business
This infographic is equal parts colorful and informative, and it never overstays its welcome by being too wordy or visually cluttered (don’t forget to take notes).
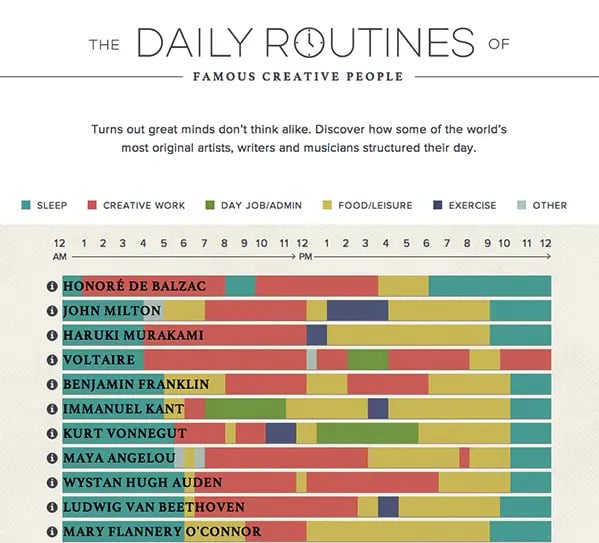
The Daily Routines of Famous Creative People
Have you ever wondered how someone like Benjamin Franklin spent a typical day? This infographic answers that question by making clever use of colored line charts.
How to Optimize Infographics for Better SEO Results
Just as you would optimize a web page to rank better on search engines like Google, you also need to optimize your infographics.
An optimized infographic has a much better chance of generating backlinks, getting shared on social media, and ranking high on Google image searches.
Here are some helpful tips for optimizing your infographics.
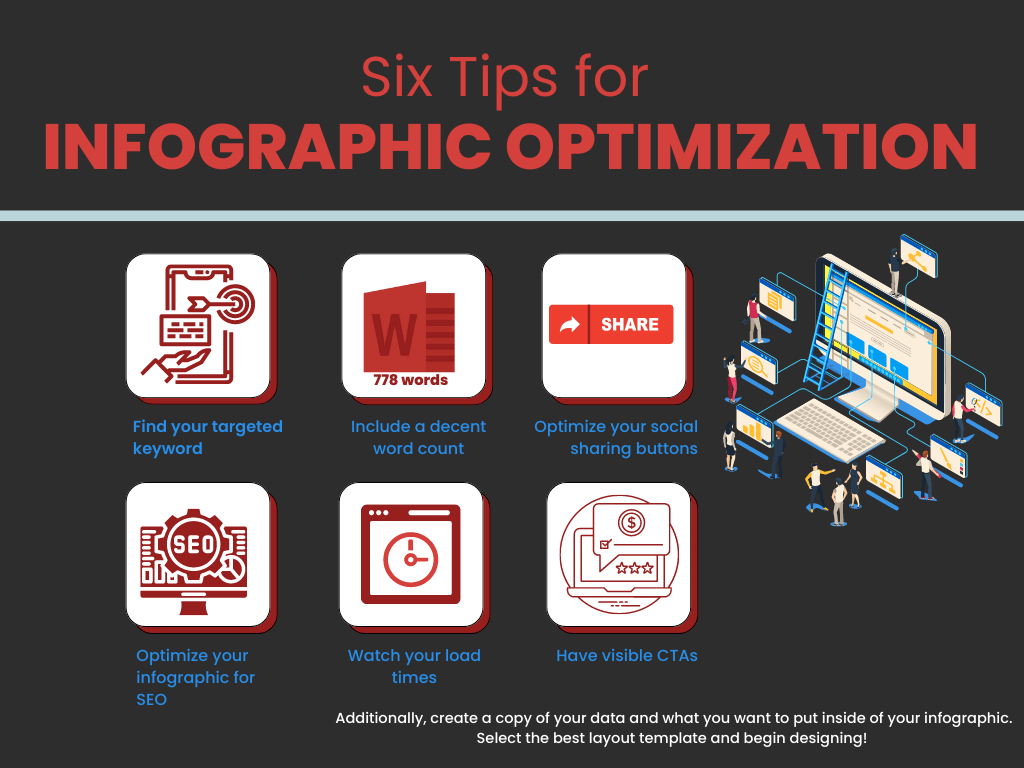
Tip #1: Use the right keywords
Thorough keyword research is the name of the game here. Identify relevant, high-volume search terms related to your infographic’s topic. From there, weave your target keyword(s) strategically into the infographic’s:
- File name (e.g., ‘social-media-marketing-trends-2023.jpg’). Use a descriptive filename incorporating your keyword (avoid special characters).
- Alt text (a concise image description).
- Surrounding text (the accompanying blog post or article).
- Header tags and meta descriptions for the page where the infographic is featured.
Metadata Matters
Alt text: Accurately describe the infographic in a few sentences, incorporating your keywords. This is essential for screen readers (ensuring accessibility) and helps search engines understand the image’s content.
Title tags: Consider adding a title tag to your infographic image for further context. While less impactful than alt text, it can still provide additional information for search engines.
Why is this important?
Metadata, like alt text and title tags, helps Google and other search engines index and crawl your website.
In addition to boosting SEO, it enhances user experience by making your visuals accessible to those with visual impairments and helps convey your message clearly to all users.
ℹ️Tips for Effective Metadata:
✔️Be descriptive: Clearly explain what’s depicted in the image.
✔️Keyword integration: Include relevant keywords naturally within your descriptions.
✔️Keep it concise: Aim for alt text under 125 characters.
✔️Avoid redundancy: Don’t start your alt text with “picture of” or “image of.”
Tip #2: Focus on User Experience
Optimize your infographic’s file size for fast loading times. Tools like TinyPNG or image compression plugins can help. Also, design your infographic to display well across all devices, including smartphones and tablets.
Tip #3: Optimize the Surrounding Content
To achieve the best results, optimize your infographic like you’d optimize any blog post or image. This helps Google understand what the infographic represents since it can’t actually see the images. Include:
Word count
Include a decent amount of text (consider 300+ words) on the page where your infographic lives. This gives search engines more context.
Header Tags
Use H1, H2, and H3 tags with relevant keywords to structure your content.Header tags (H1, H2, H3, etc.) offer a preview of your content for both your audience and search engines such as Google.
They help organize your page, making it easier to scan and provide context about the information within each section. It’s best practice to incorporate your target keywords naturally into your header tags in a way that doesn’t feel forced or spammy.
ℹ️Tips for Effective Header Tags:
✔️One H1: Use only a single H1 tag per page to define your main topic.
✔️Logical hierarchy: Use a combination of H2, H3, and H4 tags to create a clear outline.
✔️Keyword-rich: Aim to include target keywords where they fit naturally.
✔️Be descriptive: Clearly summarize the content of each section.
Tip #4: Create a meta-description
A meta description is a short summary of your webpage’s content designed to entice searchers to click on your link.
It’s the brief bit of text that appears underneath the blue hyperlink to your content on search engine results pages.
Think of it as your advertisement in search results. While Google may not always use your exact meta description (sometimes they use auto-generated descriptions even if you wrote one), it’s still important to craft compelling ones for the users who see them.
Also, Google’s crawler bots won’t always pay attention to your meta description, so it’s typically only for the benefit of your readers. For this reason, it’s wise to always include a CTA in your meta descriptions to convince users to click on your result over others.
ℹ️Tips for Creating Effective Meta Descriptions:
✔️Target your audience: What pain point does your content address? What will the reader gain?
✔️Be unique and helpful: Stand out from the other search results.
✔️Optimal length: Aim for 155-160 characters to avoid being cut off.
✔️Include a CTA: Guide the reader (“Learn more,” “Sign up,” etc.).
✔️Naturally use keywords: If you have room, include your target keyword where it makes sense.
Here’s an example:
Blog Post on Infographic Design
Target Keyword: “Infographic design tips”
Meta Description: “Learn proven infographic design tips to make your data visually stunning. Get actionable advice on layout, color, and storytelling.”
Tip #5: Optimize your URLs
URLs are the addresses of your web pages that play a role in how search engines like Google understand and rank your content. Keywords included in your URLs signal relevance to search queries.
Short and descriptive URLs are also easier to share and improve the overall user experience.
ℹ️Best practices for URL optimization:
✔️Data-driven decisions: Analyze your existing site data and conduct thorough keyword research to identify the most relevant terms to include in your URLs.
✔️On-Page and Off-page SEO: Optimize your URLs to work in conjunction with your greater SEO strategy, including the use of keywords in content and external links.
✔️Mobile matters: Ensure URLs function properly and display correctly on mobile devices.
✔️Descriptive and concise: Use keywords to describe the page’s content clearly, but keep the URL as short as possible for better readability.
✔️Hyphens are your friend: Use hyphens to clarify words within your URLs.
Here’s an example of what we mean:
Instead of a long, parameter-filled URL like:
https://www.example.com/page?id=578&category=blog
An optimized URL would be:
https://www.example.com/blog/infographic-design-tips
Tip #6: More tips for optimizing your infographics
➡️ Include social sharing buttons: Make your infographic easy to share on platforms like Facebook, TikTok, Instagram, and Twitter (X) by including social share buttons.
➡️ Call to Action (CTA): Guide your readers with a clear CTA that matches their search intent. Examples include subscribing to your email list, visiting a product page, or sharing the infographic on social media.
Best tools for SEO infographic creation
Visme
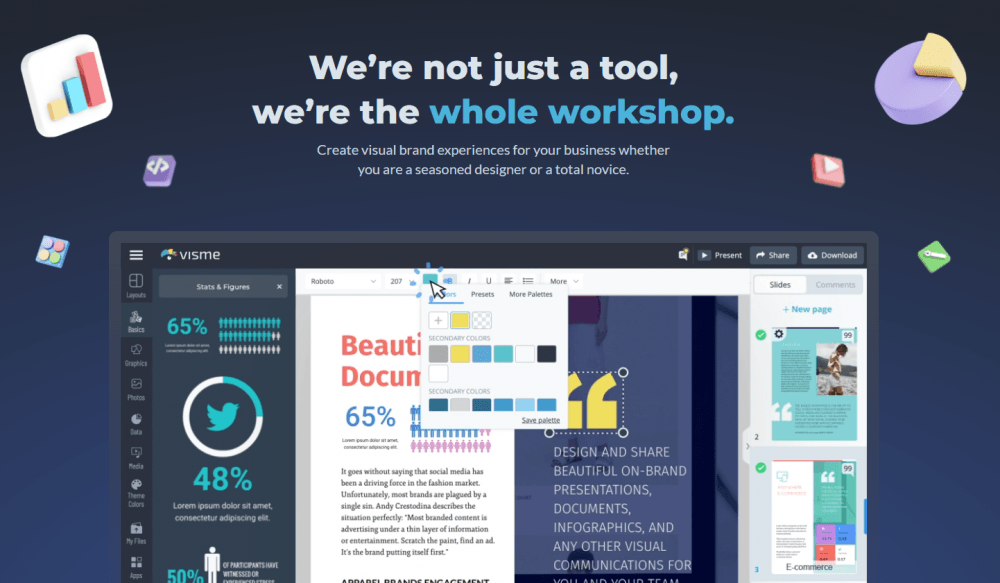
Visme is a cloud-based design platform that helps users to create various types of visual content, including presentations, reports, social media graphics, and more.
For infographics, it offers a user-friendly interface and extensive customization options.
Key Features for SEO Infographic Creation
➡️ An extensive template library: Visme provides a wide variety of pre-designed infographic templates, giving you a great starting point and saving design time.
➡️ Design elements: Visme includes a rich collection of icons, illustrations, charts, graphs, data widgets, and maps to visually represent your data.
➡️ Customization: You have control over colors, fonts, layouts, and can upload your own images or brand assets.
➡️ Integration with data sources: Link to Google Sheets or other data sources to keep your infographics up-to-date.
➡️ Embed options: Generate embed codes to easily place your infographics within blog posts or web pages.
➡️ Collaboration: Visme’s real-time collaboration features are useful if you’re working in a team.
| Pros | Cons |
| ✅User-friendly: Visme has a drag-and-drop interface, making it accessible for non-designers.
✅Versatility: You can create various visual content formats beyond infographics. ✅Design quality: Templates and graphics are professionally designed. ✅Affordability: It offers a free plan with basic features and affordable paid plans. |
❌Limited customization in the free plan: Some design elements and features might be locked behind paid tiers.
❌Occasional performance issues: Some users report slowdowns when working with complex designs. ❌Learning curve: While intuitive, maximizing all of Visme’s features might take some exploration. |
Venngage
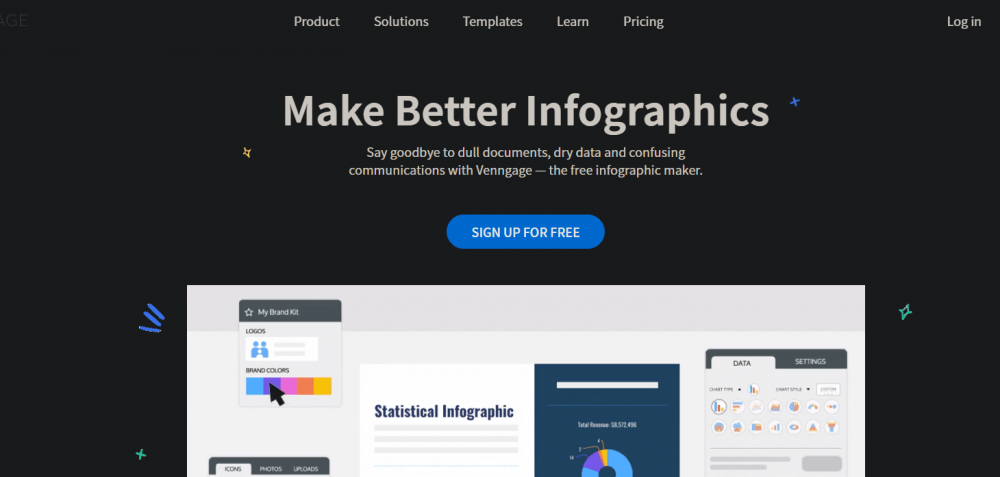
Venngage infographics creator tool offers a ton of template charts, maps, and icons. This data visualization tool offers website owners three steps to help them create an infographic design.
With this tool, you can:
- Drag and drop library pictures
- Create custom icons
- Font customization
The tool allows you to save your infographics as images or PDFs. It’s also easy to share your infographics on social media platforms, websites, and blogs.
Key features for Venngage
➡️ Intuitive collaboration tools: Venngage integrates flawlessly with popular programs like Asana, Trello, Teamwork, and Basecamp.
➡️ Plenty of options for data visualization: Whether you want to incorporate charts, graphs, or other types of visualizations – you’ll find them all here.
➡️ Comprehensive image editing: Venngage contains a comprehensive image editor complete with tools for cropping, resizing, rotating, and opacity.
➡️ Handy image search feature: Need a quick stock photo to use for an infographic? Venngage’s image search bar makes it effortless.
| Pros | Cons |
| ✅User-friendly: Venngage makes it easy to export and view your infographics at any stage of the process, and in your preferred format.
✅Versatility: No matter your industry or brand, you can use Venngage to design any type of graphic. |
❌Not enough color options: It would be nice to see more comprehensive color options such as fading and ombre.
❌Lack of customizability for templates: There are elements in Venngage’s pre-made templates that you cannot delete, which will be frustrating for designers eager to expand on existing infographic templates. |
Canva
Canva is an amazing graphic design tool that allows you to design infographics, presentations, resumes, business cards, logos, and so much more.
You can even animate videos and some irons. Canva offers versatility in design creation, whether you’re trying to make personal or business designs.
This awesome tool has everything you need to create some of the best-looking visual content.
Key features for Canva
➡️ Tons of infographic templates: There are countless templates you can use and edit with Canva’s drag-and-drop editor.
➡️ Drag-and-drop editor: You won’t run into any confusion with Canva’s editor, as it’s one of the easiest to use in the business.
➡️ Background remover: Are there details in your infographic or a stock photo that you don’t like? Canva’s background remover makes it easy to get rid of them.
➡️ Tons of stock elements to use: Canva has an extensive library of stock images, graphics, and templates.
| Pros | Cons |
| ✅User-friendly: Canva is one of the easiest design programs to learn, and there’s no shortage of educational materials to help you get the hang of it.
✅Free to use: While Canva Pro is an option (and can definitely be worth it), a regular Canva account is completely free. |
❌Occasional slow down: Since Canva is an SaaS (software-as-a-service), you’re dependent on their servers. Whenever things slow down (which can be quite common), there’s nothing you can do about it.
❌Not every font or template is free: Certain fonts and templates are blocked behind paywalls, which is unfortunate. |
Infographics and Your SEO strategy
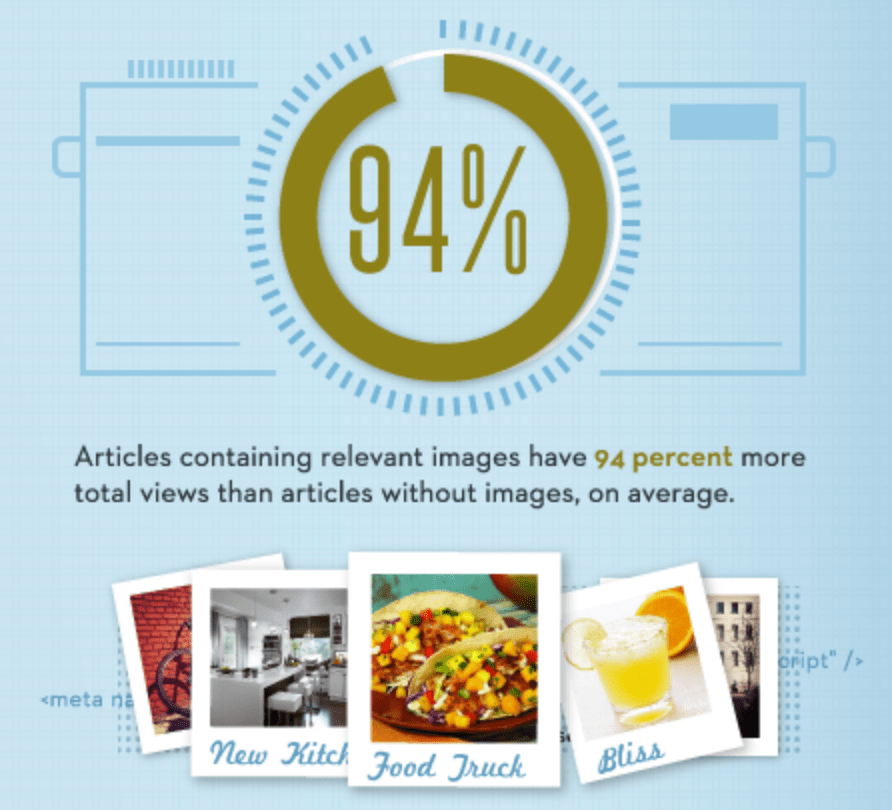
Infographics, when done right, offer all kinds of SEO benefits.
Their visual nature and easy-to-digest format make them highly shareable, increasing the potential for going viral and attracting valuable backlinks.
Studies even suggest that content featuring images or infographics receives 94% more views, so they’re definitely worth your time.
Tips for Integrating Infographics into Your SEO Efforts
- Strategic Planning: Define clear goals for your infographics (brand awareness, traffic, etc.). Ensure your infographics target your audience, and then select the best platforms for sharing them.
- Design with Purpose: Create high-quality infographics that make sense of compelling data. Optimize them with relevant keywords and hashtags (for social media platforms like Instagram and X).
- Promote Widely: Develop a multi-channel promotion plan. This includes social media, link-building outreach to relevant blogs/influencers, and repurposing the infographic’s data into other formats.
- Never Neglect SEO: Treat your infographic like any other piece of content. Optimize file names, alt-text, surrounding text, etc.
- Track and Adapt: Analyze results to see what works best. Are certain topics or visual styles more popular? Use this data to refine your future infographics.
Let’s Wrap it Up
Infographics are an extremely powerful tool for boosting your website’s visibility, engagement, and overall user experience.
Following the strategies outlined in this guide will transform complex information into breathtaking visuals that drive results for your digital marketing campaign.
Ready to take your SEO to the next level with infographics? Here’s how to get started:
Explore our resources: We offer free SEO tools and resources to help you get started on the right foot. Sign up for free today!
Need Expert Guidance? Book a call with one of our SEO experts to develop a custom infographic strategy tailored to your business.
Enhance Your existing plan: If you’re already on a HOTH X managed SEO plan, inquire about adding custom infographic creation to take your content marketing to new heights.
Remember: Infographics are an investment in your brand’s online success. Don’t miss out on their massive potential!
Leave a comment